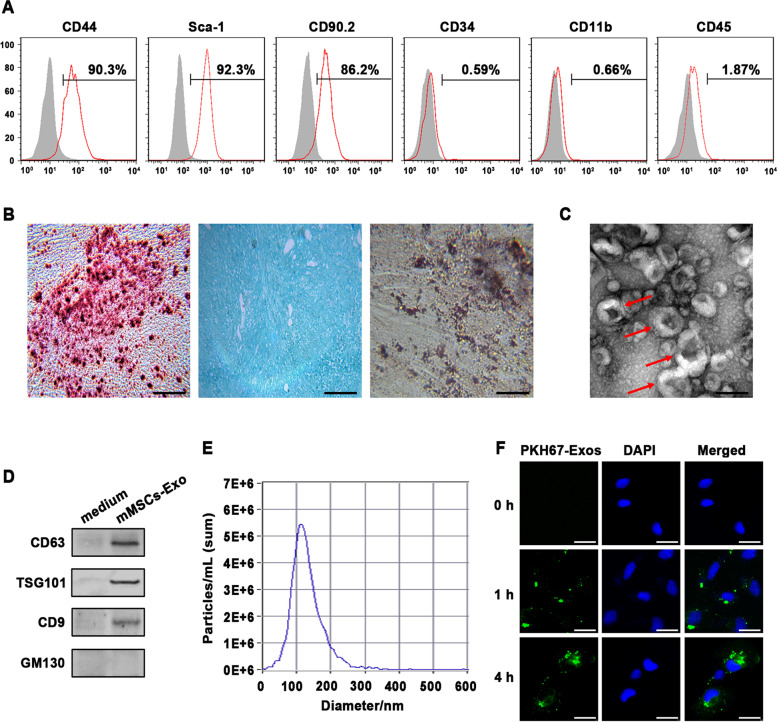
Fig. 1.
Identification of mouse mesenchymal stem cells (mMSCs) and mMSCs-derived exosomes. A Flow cytometric analysis for cell surface markers of CD44, Sca-1, CD90.2, CD34, CD11b, and CD45 on mMSCs. Percentage of positive cells shown in upper right corner as standardized with the isotype control antibody-incubated cells. B Assessment of differentiating capacity of mMSCs into osteocytes, chondrocytes, and adipocytes stained by Alizarin Red (left), Alcian Blue (middle), and Oil Red (right), respectively. Scale bar = 100 μm. C Representative image of transmission electron microscopy of mMSCs-Exo, and red arrows indicate typical exosomes. Scale bar = 200 nm. D Western Blot analysis for exosomal markers CD63, TSG101, and CD9, as well as the negative marker GM130 in mMSCs-Exo. The culture medium was used as control. E Nanoparticle tracking analysis of mMSCs-Exo. F Confocal images shown that PKH67-labeled exosomes (green) were taken up by MLE-12 cells at indicated time points in vitro. Nuclei were counterstained with DAPI. Scale bar = 40 μm

