
Figure 5. Spatial transcriptomic analysis of fibroblasts in scarring and regeneration.
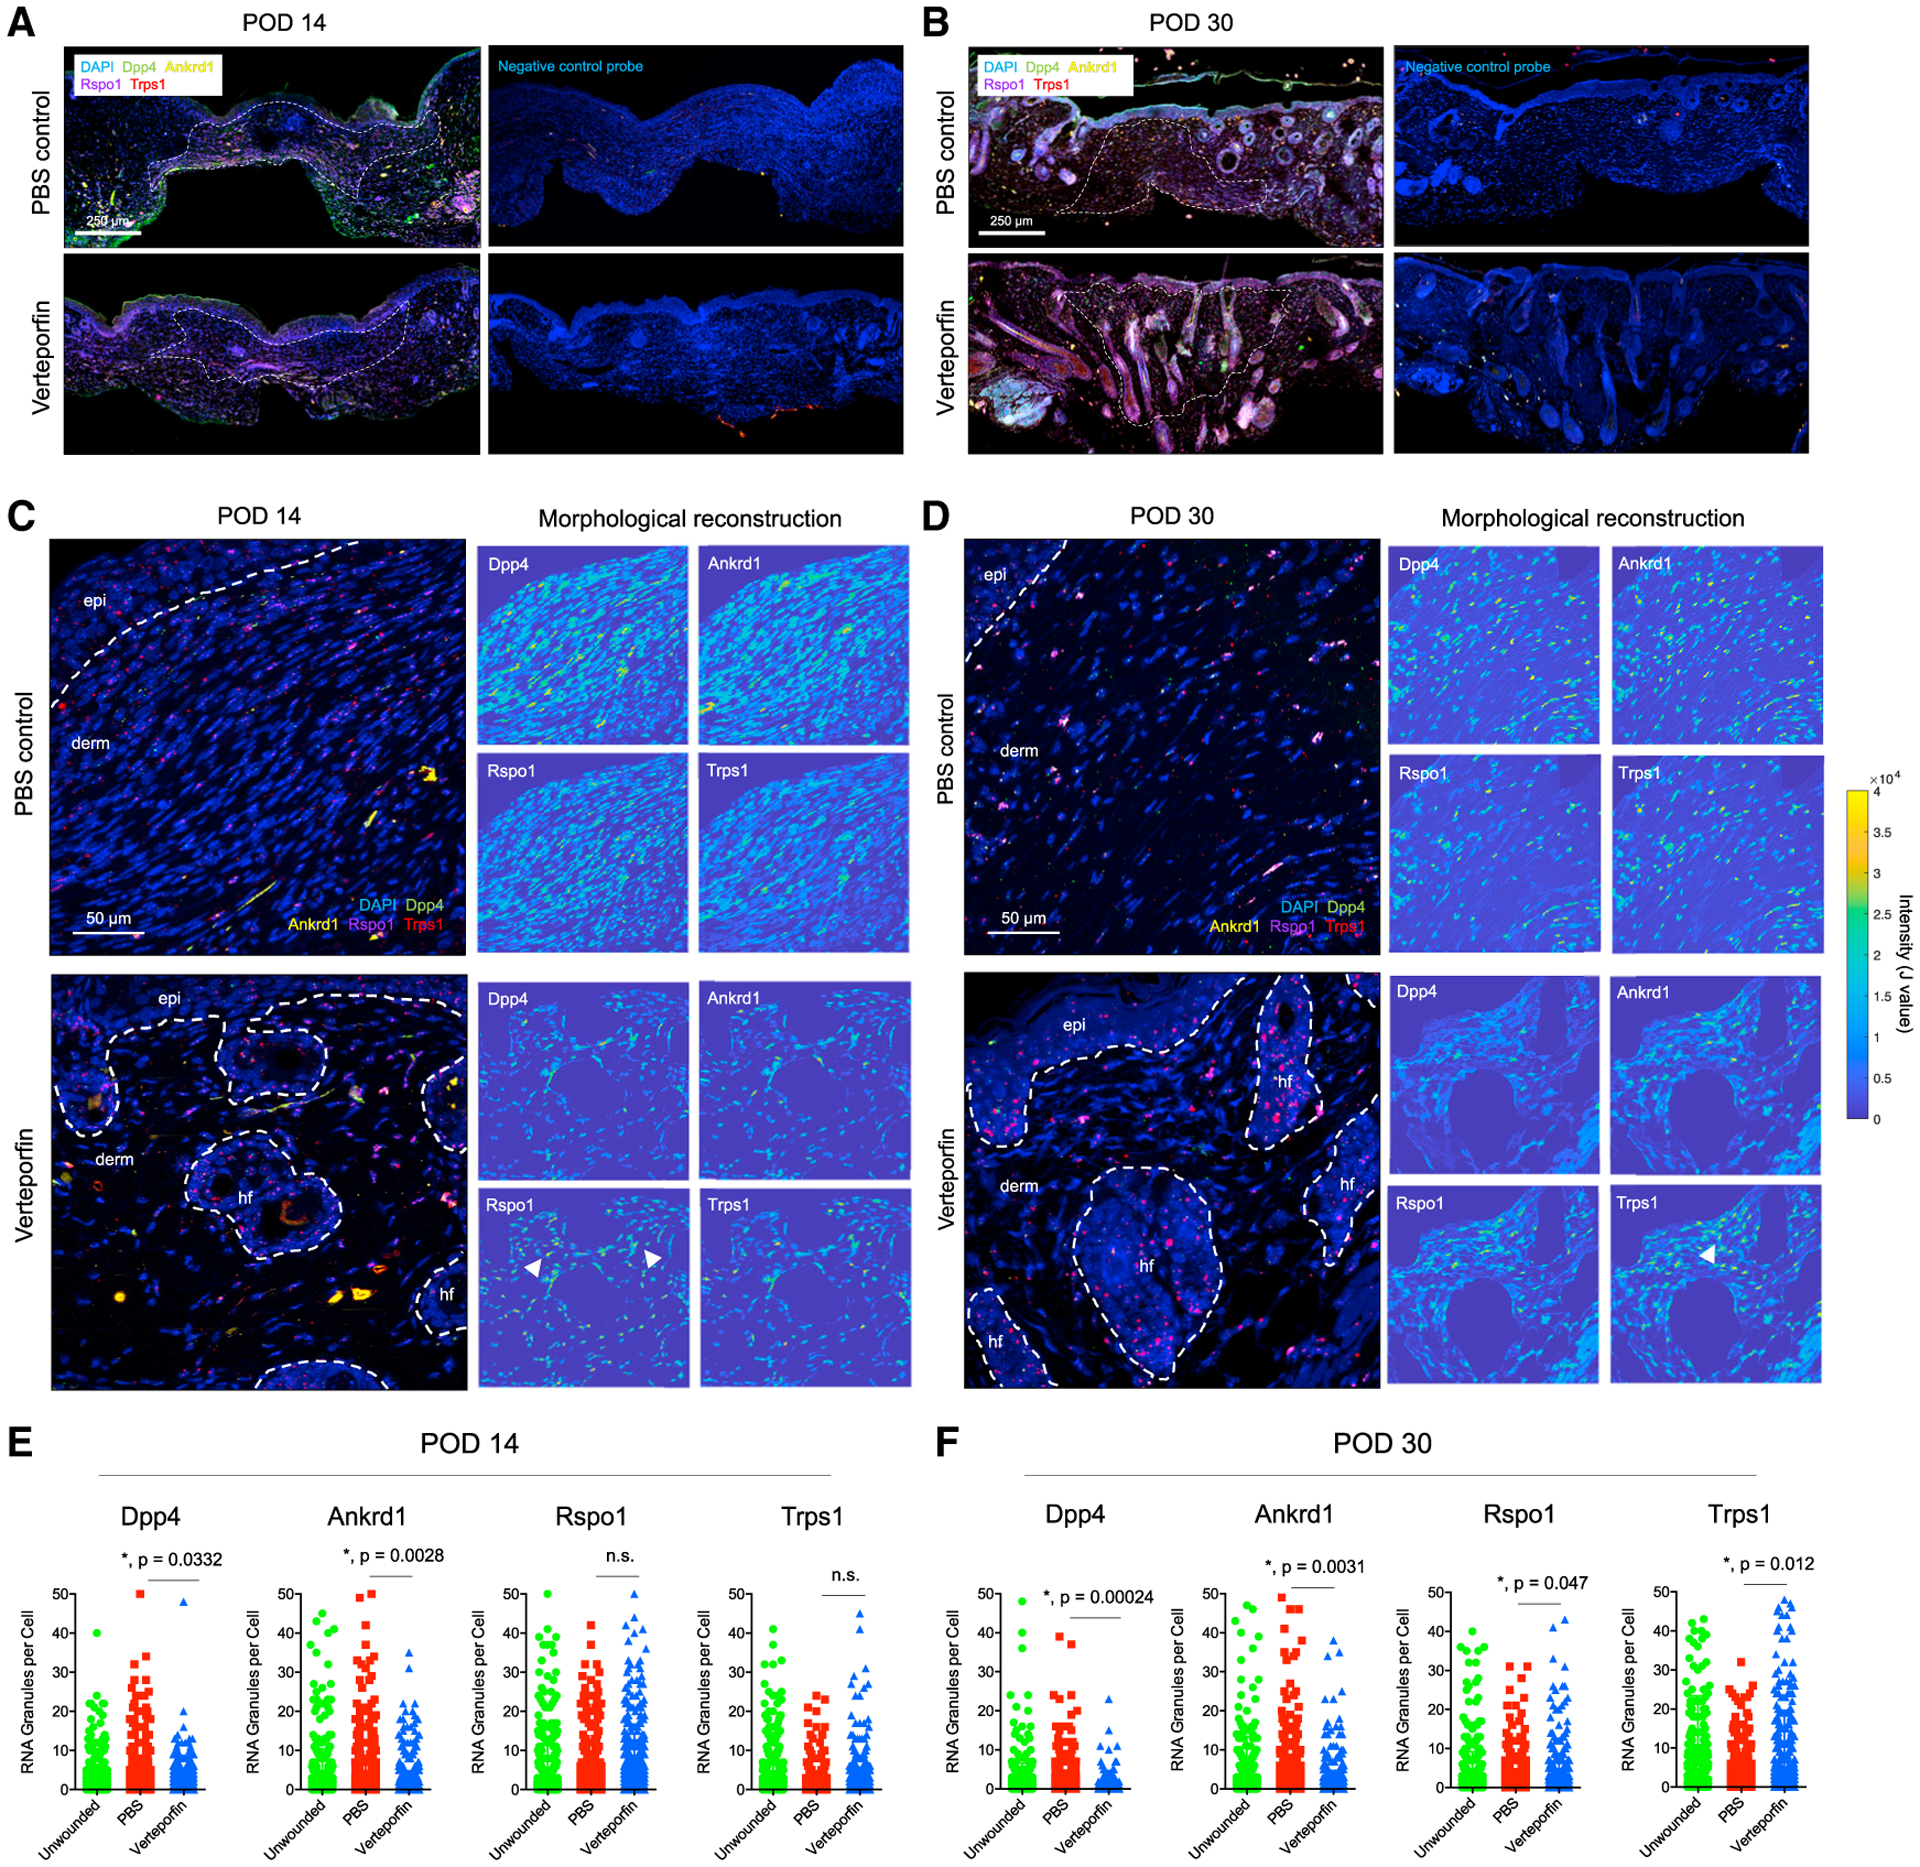
(A and B) Low-power tile scan of RNAscope multiplexed in situ hybridization for Dpp4 (green), Ankrd1 (yellow), Rspo1 (magenta), and Trps1 (red) in PBS- and verteporfin-treated wounds at POD 14 (A) and 30 (B). White dotted line, scar boundary. Right panels, neighboring slides hybridized with negative control scrambled probes.
(C and D) High-power images of RNAscope granules in PBS- and verteporfin-treated wounds at POD 14 (C) and 30 (D). White dotted line, quantified regions of interest in dermis. Right panels, morphological reconstructions (dermis only; epidermis and HF excluded); yellow, cells strongly expressing indicated gene.
(E and F) Quantification of Dpp4, Ankrd1, Rspo1, and Trps1 RNA puncta per cell in POD 14 (E) and 30 (F) specimens.