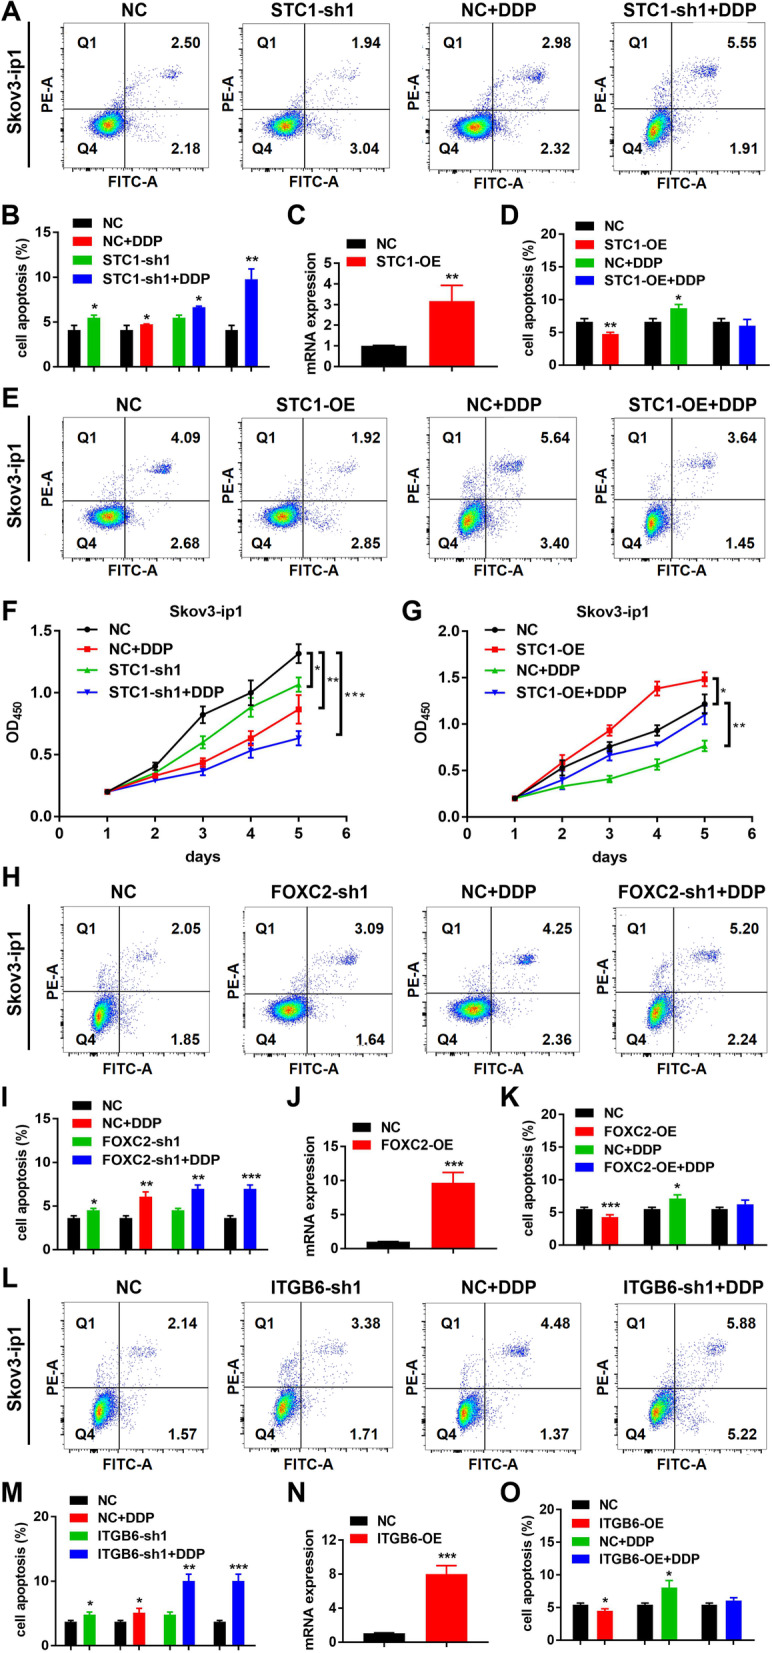
Fig. 7.

Targeting STC1 and the FOXC2/ITGB6 signaling axis is related to DDP chemoresistance in vitro. A-B Cell apoptosis results in the NC, NC + DDP, STC1-sh1 and STC1-sh1 + DDP groups in Skov3-ip1 cells. C The mRNA level of STC1-OE expression in Skov3-ip1 cells was confirmed by real‐time PCR. D-E Cell apoptosis results in the NC, STC1-OE, NC + DDP and STC1-OE + DDP groups in Skov3-ip1 cell lines. F The results of cell proliferation assays in the NC, NC + DDP, STC1-sh1 and STC1-sh1 + DDP groups in Skov3-ip1 cells. G The results of cell proliferation assays in the NC, STC1-OE, NC + DDP and STC1-OE + DDP groups in Skov3-ip1 cell lines. H-I Cell apoptosis results in the NC, NC + DDP, FOXC2-sh1 and FOXC2-sh1 + DDP groups in Skov3-ip1 cells. J The mRNA level of FOXC2-OE expression in Skov3-ip1 cells was confirmed by real‐time PCR. K Cell apoptosis results in the NC, FOXC2-OE, NC + DDP and FOXC2-OE + DDP groups in Skov3-ip1 cell lines. L-M Cell apoptosis results in the NC, NC + DDP, ITGB6-sh1 and ITGB6-sh1 + DDP groups in Skov3-ip1 cells. N The mRNA level of ITGB6-OE expression in Skov3-ip1 cells was confirmed by real‐time PCR. O Cell apoptosis results in the NC, ITGB6-OE, NC + DDP and ITGB6-OE + DDP groups in Skov3-ip1 cell lines. (Data are shown as the means ± SD. Significance was calculated using Student’s t test. *, P < 0.05, **, P < 0.01, ***, P < 0.001, ****, P < 0.0001.)
