
FIGURE 5.
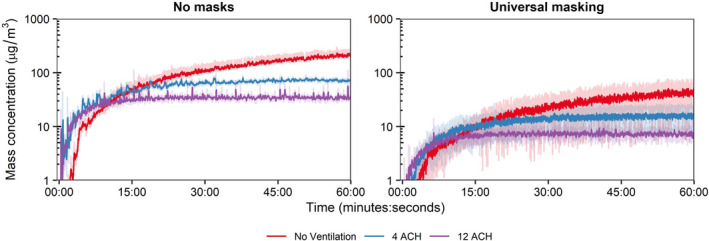
Extended breathing assessment. Mass exposure concentration‐time curves over 60 min for breathing at the 1.8 m physical distance and three ventilation rates. Results are the arithmetic mean ± standard deviation of three independent experiments. ACH, Air changes per hour