FIGURE 2.

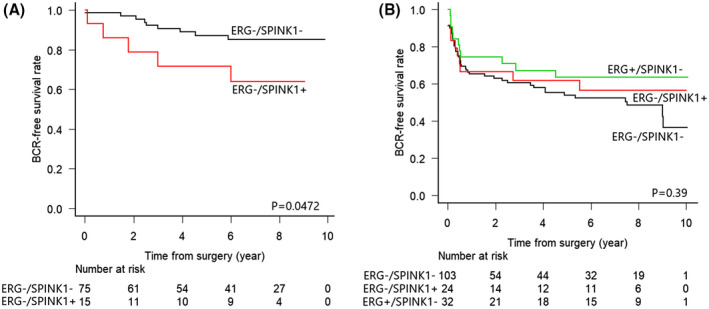
Kaplan–Meier curves for BCR in TZ (a) and PZ (b) cases stratified by ERG/SPINK1 status. In both figures, the black line shows ERG‐/SPINK1‐cases, the red line shows ERG‐/SPINK1 + cases, and the green line shows ERG+/SPINK1‐cases

Kaplan–Meier curves for BCR in TZ (a) and PZ (b) cases stratified by ERG/SPINK1 status. In both figures, the black line shows ERG‐/SPINK1‐cases, the red line shows ERG‐/SPINK1 + cases, and the green line shows ERG+/SPINK1‐cases