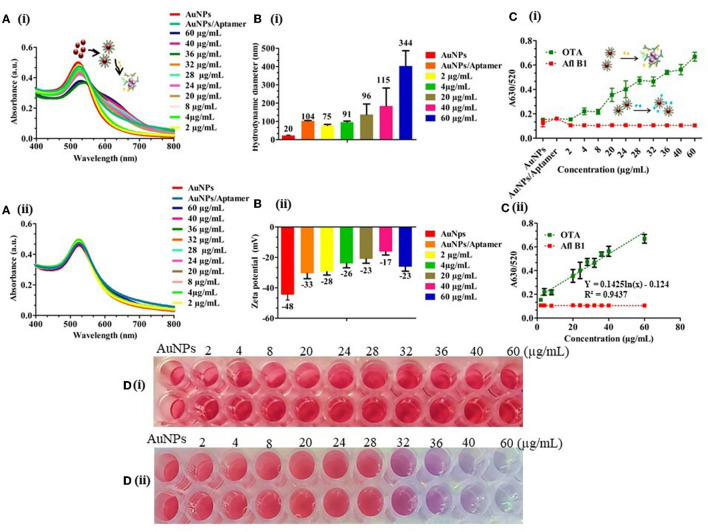
Figure 3.
Detection of OTA in spiked water samples; (A) (i) and (ii) UV-vis spectra of different concentrations of OTA and Afl B1 (60–2 μg/mL) with OTA aptamer; (B) (i) and (ii) Hydrodynamic diameter and Zeta potential of the same which indicated decreased stability with an increased surface charge from −48 to −23 mV; (C) (i) A630/520 of OTA and Afl B1; (C) (ii) Calibration curve of A630/520 of OTA and Afl B1; (D) (i) and (ii) Photograph of different concentrations of OTA and Afl B1 with OTA aptamer.

