FIGURE 1.

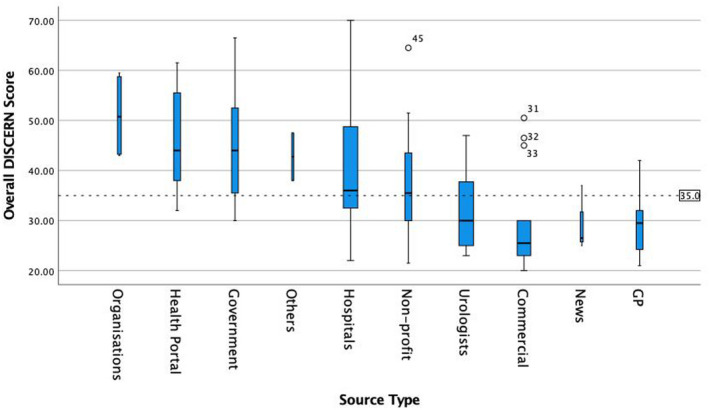
Boxplot of overall DISCERN score grouped by source type. Width of boxes and error bars scaled to source type frequency. Grand median 34 represented by dashed line

Boxplot of overall DISCERN score grouped by source type. Width of boxes and error bars scaled to source type frequency. Grand median 34 represented by dashed line