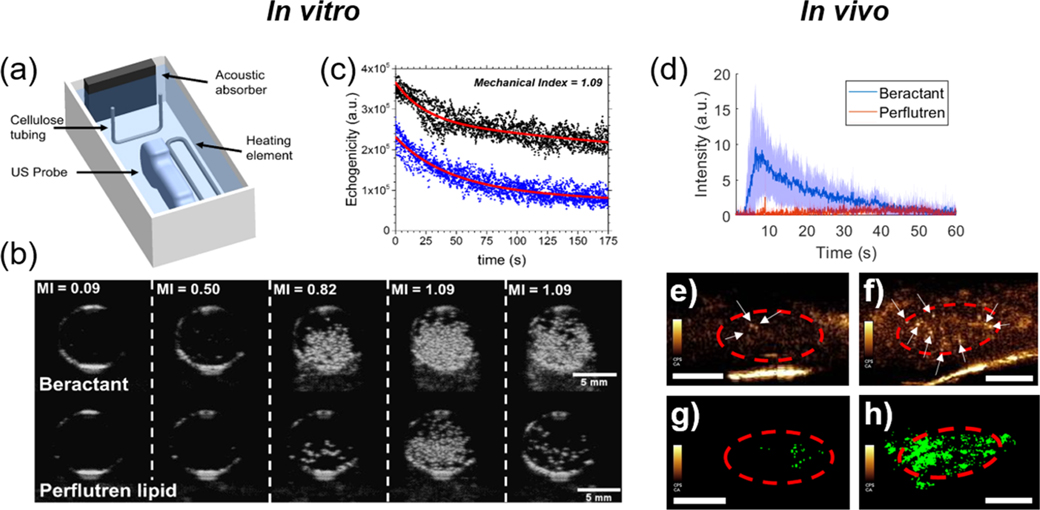
Figure 4.
Acoustic droplet vaporization for ultrasound imaging. (a) Experimental diagram showing the cellulose sample chamber and ultrasound probe. (b) B-mode ultrasound images of the cellulose tube cross section taken at 8 MHz at a constant temperature of 37 °C. Representative images of an experiment for beractant- (top panel) and perflutren lipid (bottom panel)-coated nanodrops with a liquid decafluorobutane core. The mechanical index (MI) was increased from 0.09 to 1.09, as shown. (c) Video intensities of six experiments overlaid for beractant (black, n = 6) and perflutren lipid (blue, n = 6). The red curves are exponential regressions to guide the eye. In vivo demonstration of contrast generation from beractant vs perflutren lipid nanodrops. (d) Time intensity curves resulting from beractant and perflutren lipid nanodrops. Data presented as mean (solid line) ± SD (shaded area) with n = 4 replicates per group. AUCs between the two groups were found significantly different (p < 0.0001). The circulation half-life for beractant was found to be 11.4 s. (e,f) Example contrast frames showing microbubbles resulting from perflutren lipid (e) and beractant (f) nanodrop vaporization. The region of interest consisting of the kidney is outlined in red, and echogenic postvaporization microbubbles are shown by white arrows. (g,h) Example of maximum intensity projection of the kidney vasculature data generated from a single perflutren lipid (g) and beractant (h) nanodrop bolus administration using clinically approved contrast doses, hardware, and imaging settings. Scale bar = 0.5 cm.

