FIGURE 2.

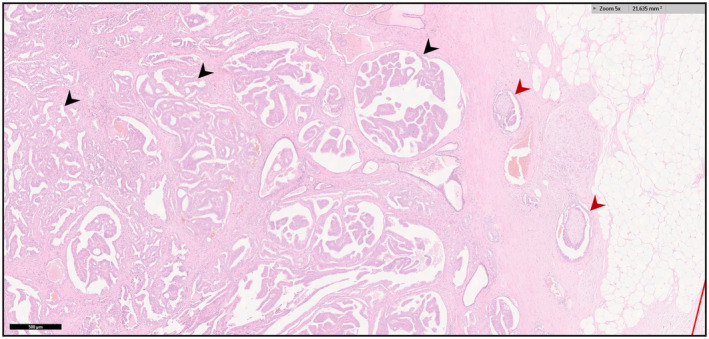
Histology of DAC. Black arrows indicate ductal cancer glands. Red arrow indicates extra‐prostatic extension. Scale bar 500 µm

Histology of DAC. Black arrows indicate ductal cancer glands. Red arrow indicates extra‐prostatic extension. Scale bar 500 µm