
FIGURE 2.
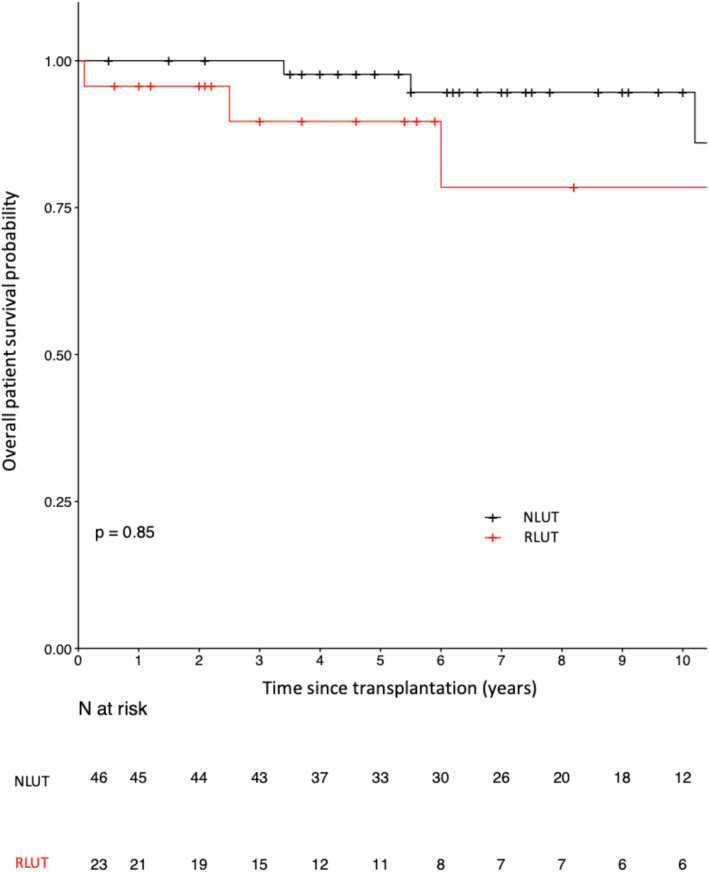
Patient survival curves in the patients who underwent lower urinary tract (LUT) reconstruction (IRLUT) and matched controls with a normal LUT (NLUT)
Official websites use .gov
A
.gov website belongs to an official
government organization in the United States.
Secure .gov websites use HTTPS
A lock (
) or https:// means you've safely
connected to the .gov website. Share sensitive
information only on official, secure websites.
Patient survival curves in the patients who underwent lower urinary tract (LUT) reconstruction (IRLUT) and matched controls with a normal LUT (NLUT)