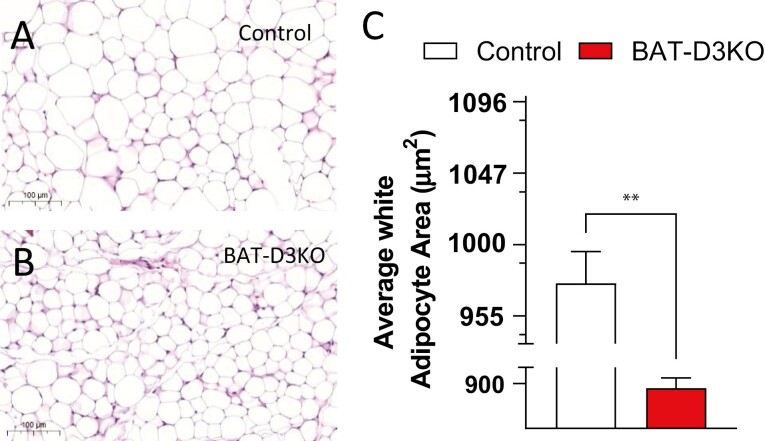
Figure 2.
Subcutaneous fat pad histology in adult BAT-D3KO mice. A, Representative microphotographs (×10 magnification) of hematoxylin and eosin–stained sections of subcutaneous fat pads in control mice and B, BAT-D3KO mice; C, subcutaneous adipocyte area in BAT-D3KO and control animals; areas were measured using Image J software from 3 different animals per group (~1000 cells per animal); all values are shown as mean ± SEM; n = 9 per group; **P less than .01 vs control (t test).

