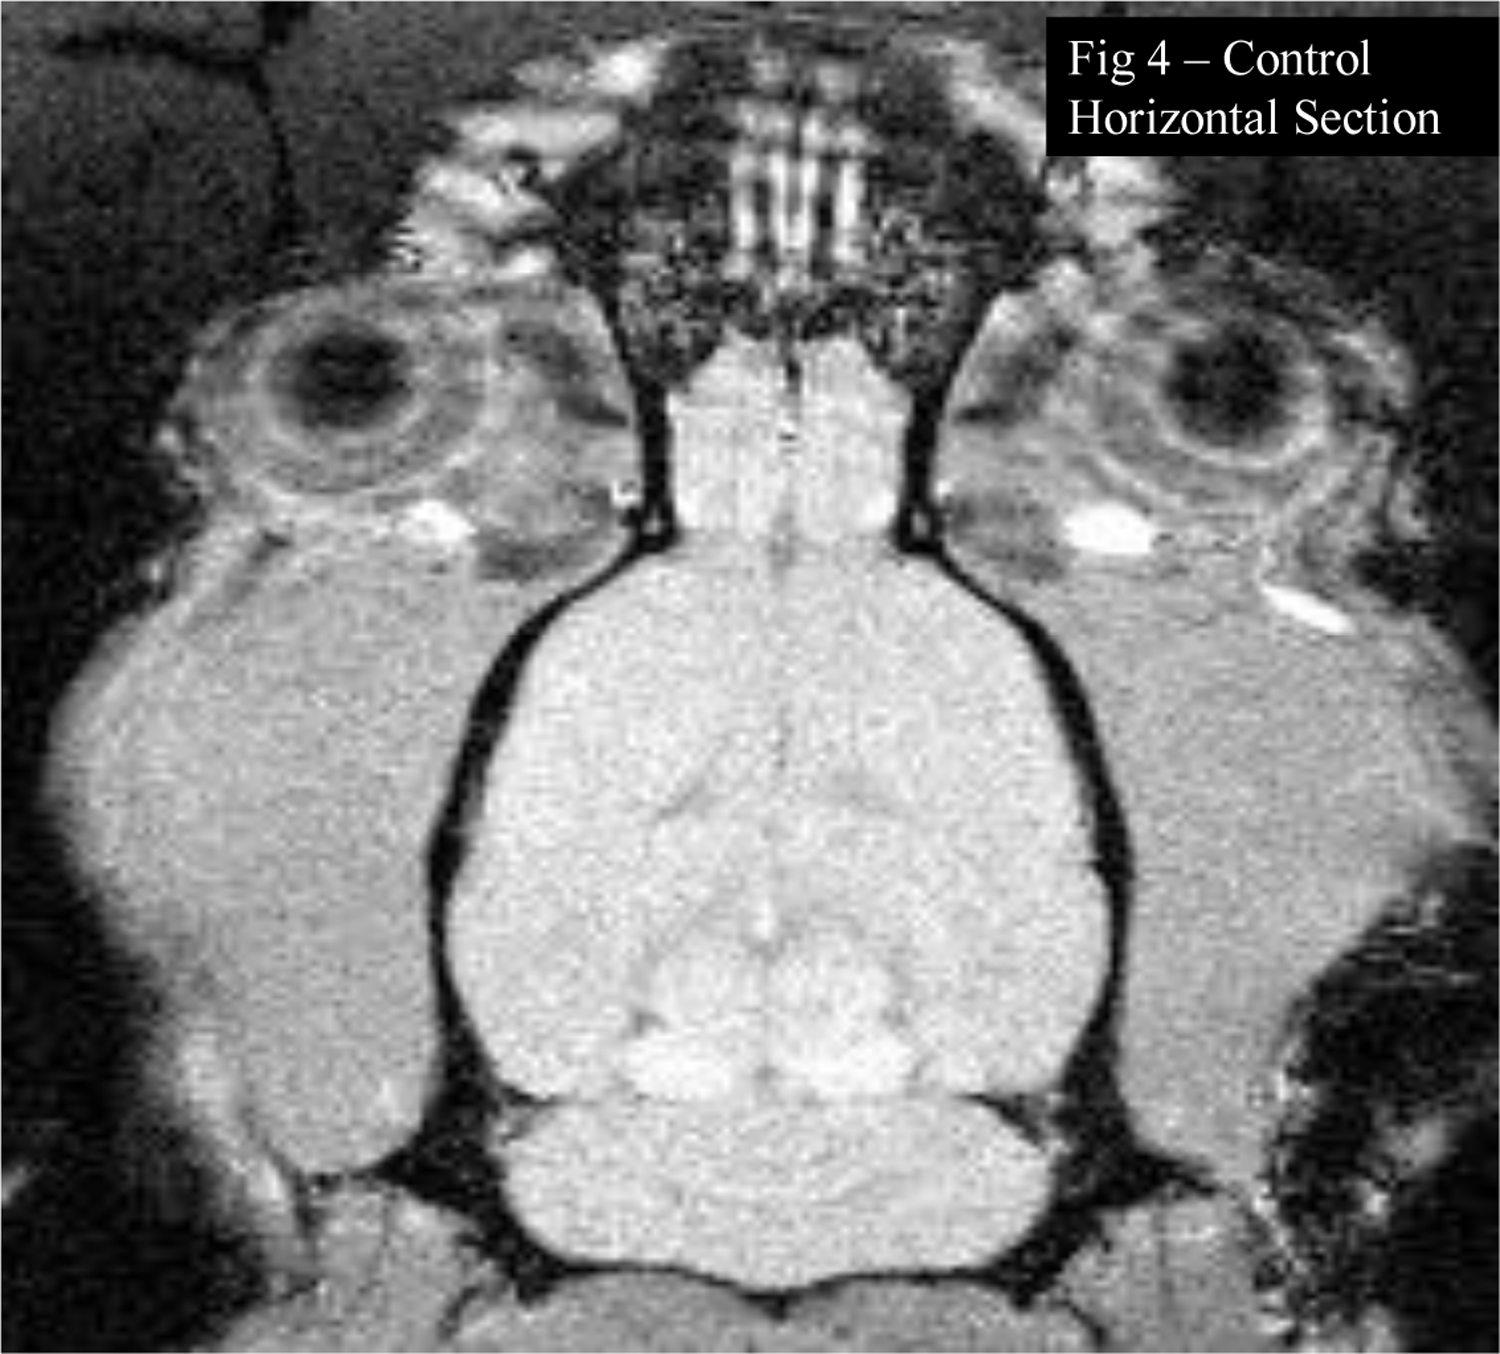
Figure 4:

T1-weighted MRI presents a horizontal section of a rat brain from the intact control group, at the same level shown in Figure 3. High intensity signals are observed in the midbrain tegmentum, but less extensively than in the Mn treated rat brain. Tiny focus of high intensity is shown in the pineal gland in both Figures 3 and 4.
