Figure 1.
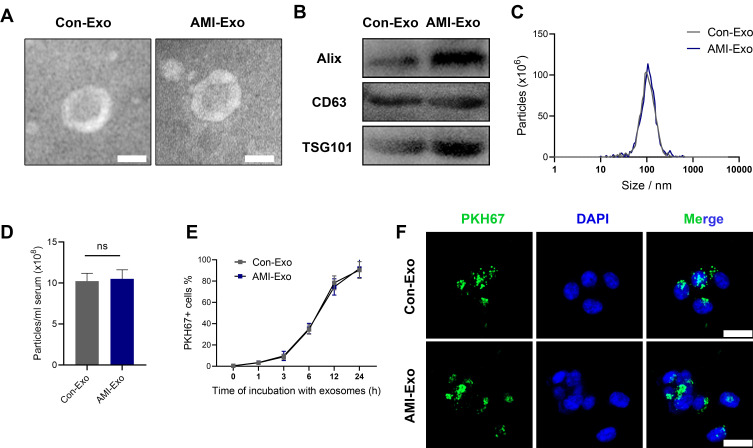
Exosome characterization and internalization pathways. (A) Transmission electron microscopy images of exosomes isolated from the two groups. Scale bar, 100 nm. (B) Protein expression of the exosomal markers Alix, CD63, and TSG101. (C) Exosome particle diameter distribution. (D) The concentration of exosome between control group and AMI individuals. (E) Exosome uptake was analyzed at the indicated times using flow cytometry. (F) Exosome uptake in human umbilical vein endothelial cells (HUVECs) incubated with PKH67-labeled exosomes (green), as analyzed by confocal imaging. Nuclei were dyed with DAPI (blue). Scale bar, 20 μm.

