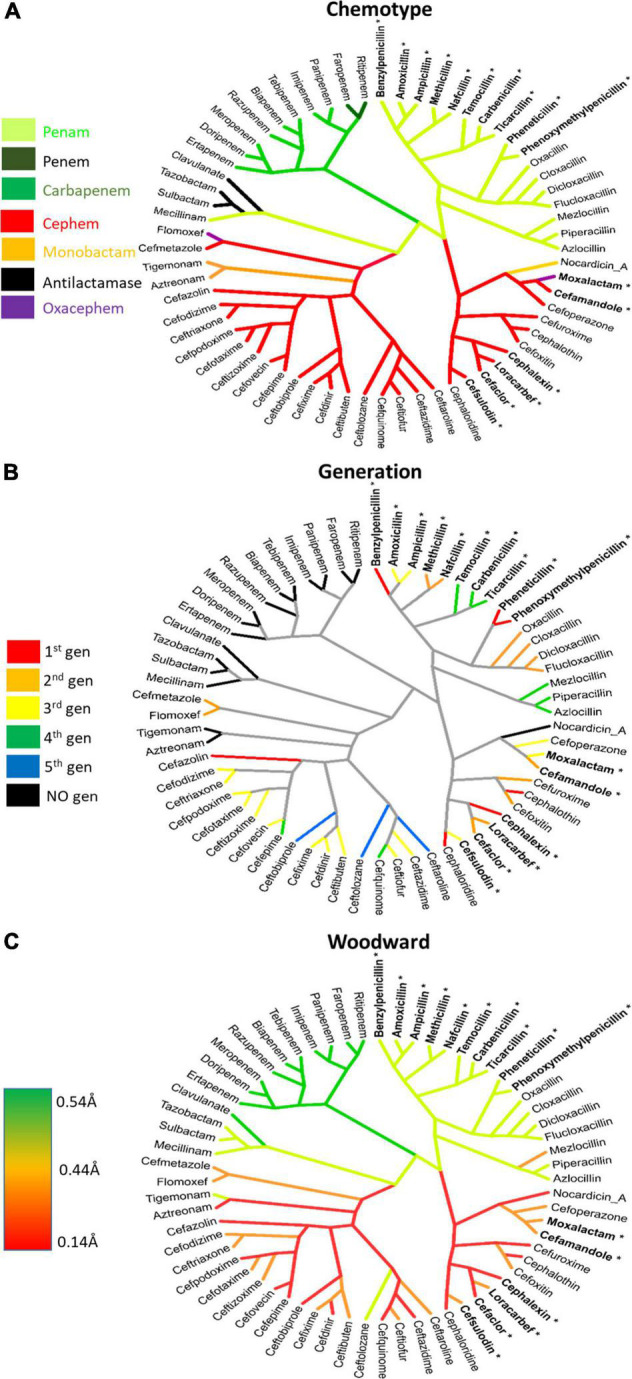
FIGURE 5.

Lactamomes depicting (A) chemotype, (B) compound generation, and (C) h-Woodward values. (A) The chemotype is a reproduction of Figure 4 to aid comparisons to the other figures. (B) The generational lactamome assigns generation levels (1st–5th) to individual drugs based on how they most currently referenced in literature. Individual drugs that do not conform to generational naming are colored in black. (C) h-Woodward lactamome is colored using a heatmap with higher h-Woodward values in green and lower h-Woodward values in red. Bolded lactams marked with an asterisk indicate drugs with high allergy (>10%) relating to the R1 benzyl groups.
