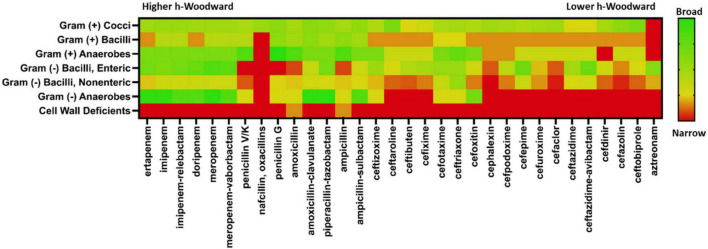
FIGURE 6.
Antimicrobial spectra of β-lactams. Clinical activity data were taken from The Stanford Guide to Antimicrobial Therapy. A fractional coverage index was calculated using a weighted average of categorical coverage values reported. Heatmap color range is from green indicating high coverage and red indicating low coverage. Beta-lactams are ordered from highest h-Woodward value (ertapenem) to lowest (aztreonam).

