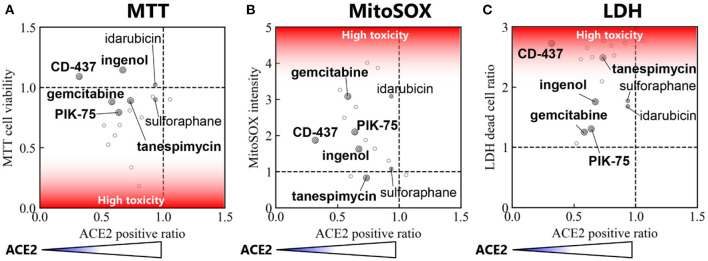
Figure 5.
Correlation between ACE2 positive ratio vs. cell toxicity. Correlation between ACE2 positive ratio and (A) cell viability measured by MTT assay, (B) MitoSOX Assay, and (C) LDH assay. The locations of the top 7 small molecules with reduced cytotoxicity in Table 2 are labeled.

