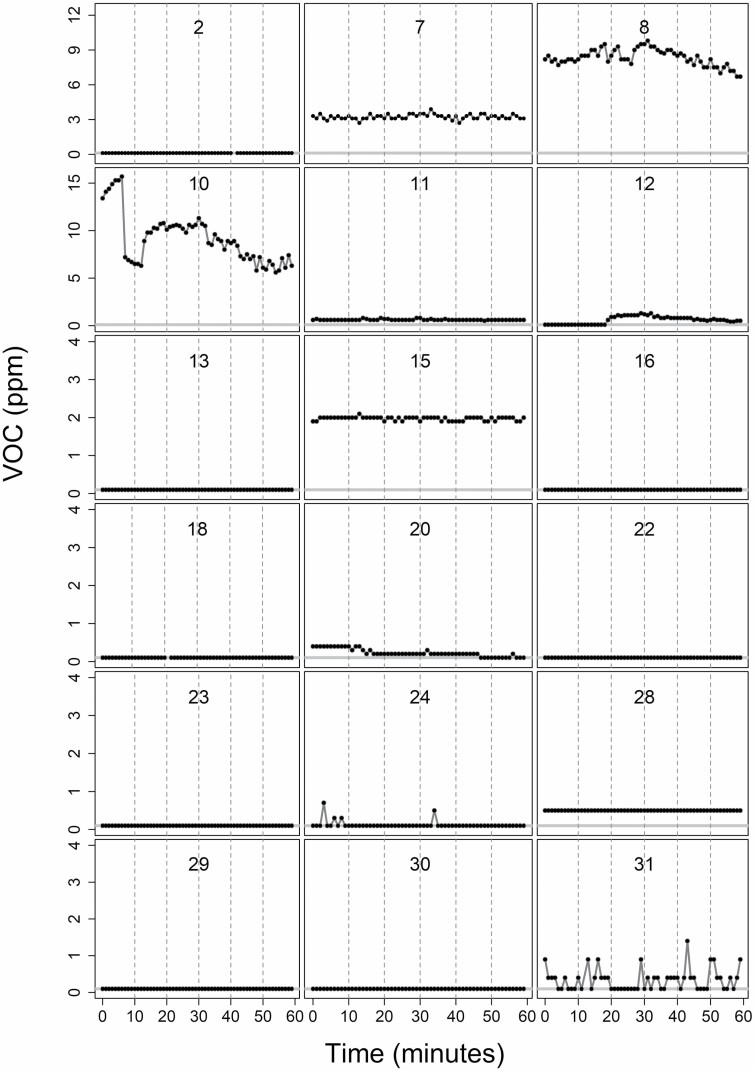
Figure 3.
VOC concentrations within the 12:00–13:00 h on 6/28/2010 for selected instruments. The horizontal gray band represents the limit of reporting (LOR = 0.05 ppm). Each instrument that operated on this vessel on any day was given a number, 1–31. Only operational instruments (out of 35 total instruments) are presented. No modeling was performed, and censored values were imputed for these plots as the LOR. The VOC ppm scales for instruments 2, 7, and 8 are 0–12 ppm. Instruments 10–12 have a scale of 0–16 ppm. The remaining instruments have a scale of 0–4 ppm.

