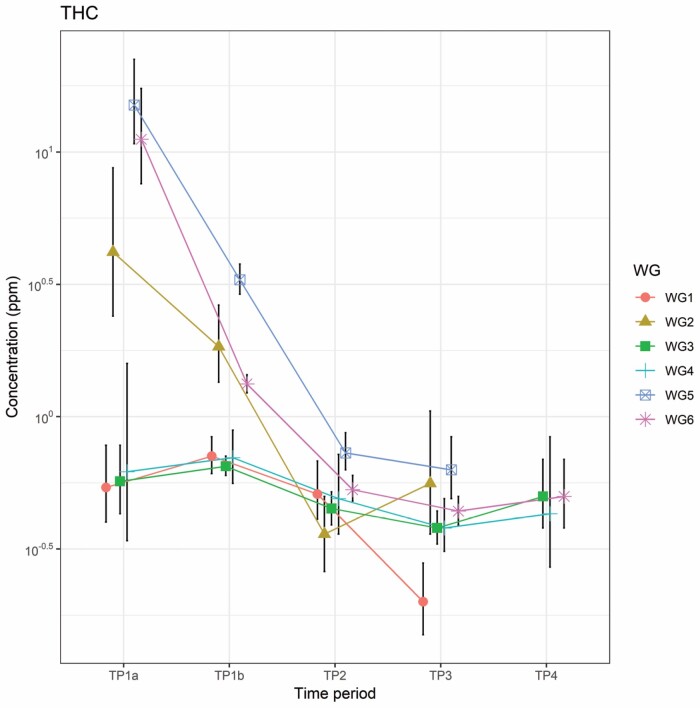
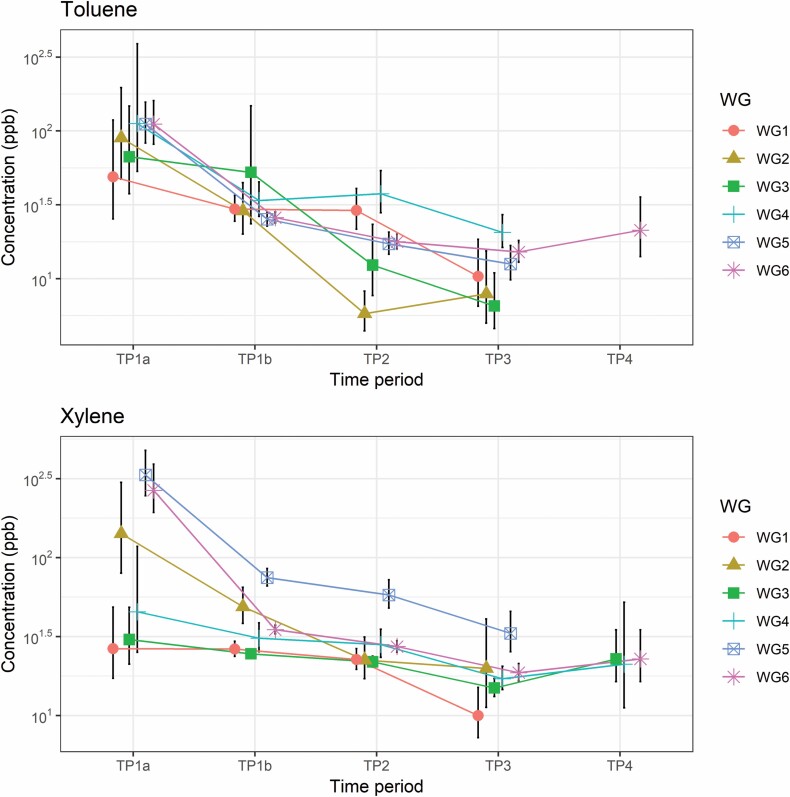
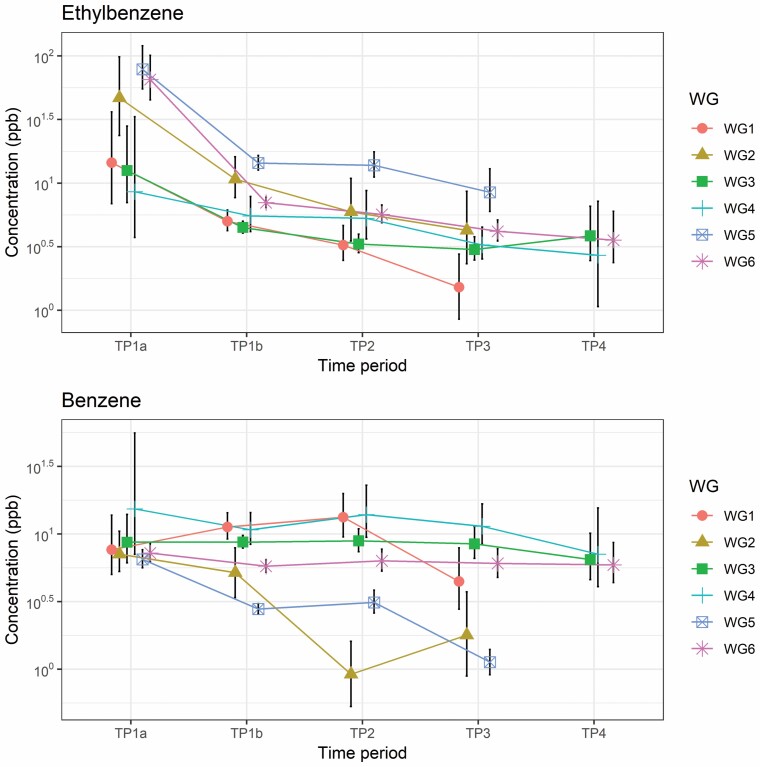
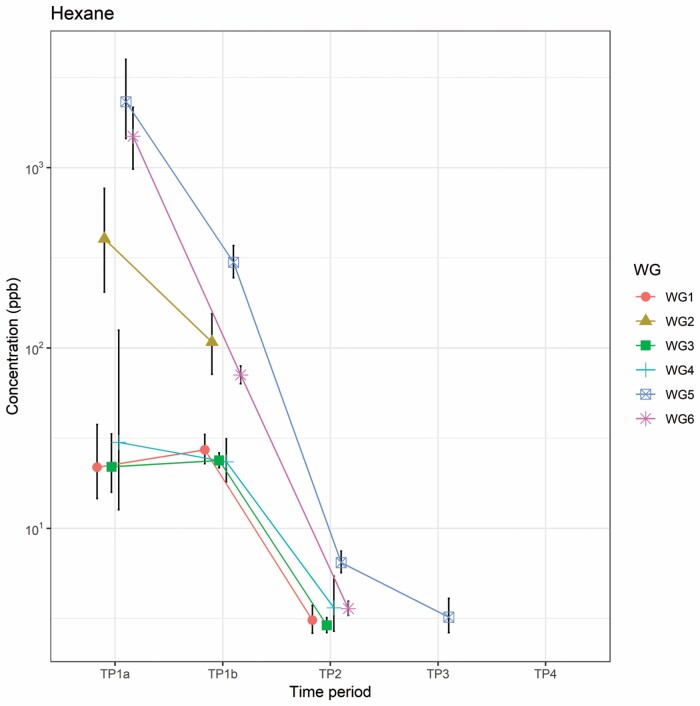
Figure 1.
(a) Time trends of the AM estimates of selected work groups (WGs) for ‘All states’ for THC: WG1 (‘Vessel put out, inspected, moved, or collected booms or absorbents’), WG2 (‘IH/Safetywater’), WG3 (‘Vessel could see shoreline (nearshore)’), WG4 (‘Vessel handled oily boom and absorbents, and personally handled oily boom’), WG5 (‘Could see wellhead from vessel’), and WG6 (‘Worked on a boat or ship’). Note differences in the scale and measurement units of each graph. See Supplementary Material (available at Annals of Work Exposures and Health online) for definitions of time period. (b) Time trends of the AM estimates of selected WGs for ‘All states’ for toluene and xylene. (c) Time trends of the AM estimates of selected WGs for ‘All states’ for ethylbenzene and benzene. (d) Time trends of the AM estimates of selected WGs for ‘All states’ for hexane. The WGs are the same as THC.


