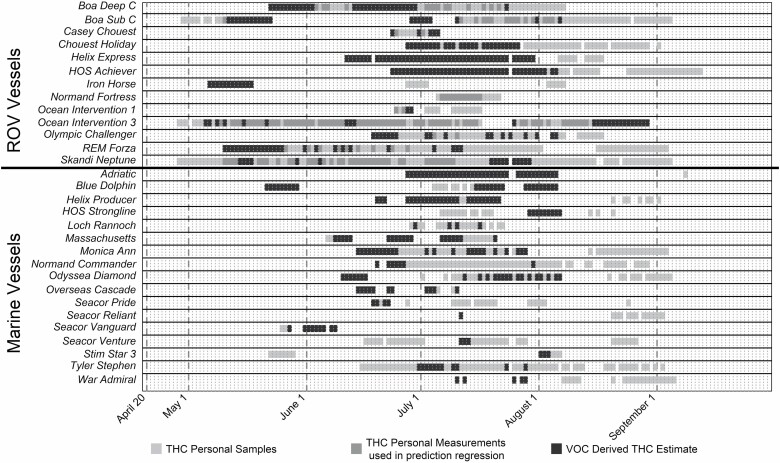
Figure 2.
Days for which THC and VOC measurements were available for 13 ROV vessels and 17 MVs. The figure shows days for which only THC personal samples were available (the light squares), days when both VOC and THC measurements were available and used in the regression analysis (darker squares), and days when only VOC measurements were available for the VOC-derived “THC” TWA estimates (darkest squares).

