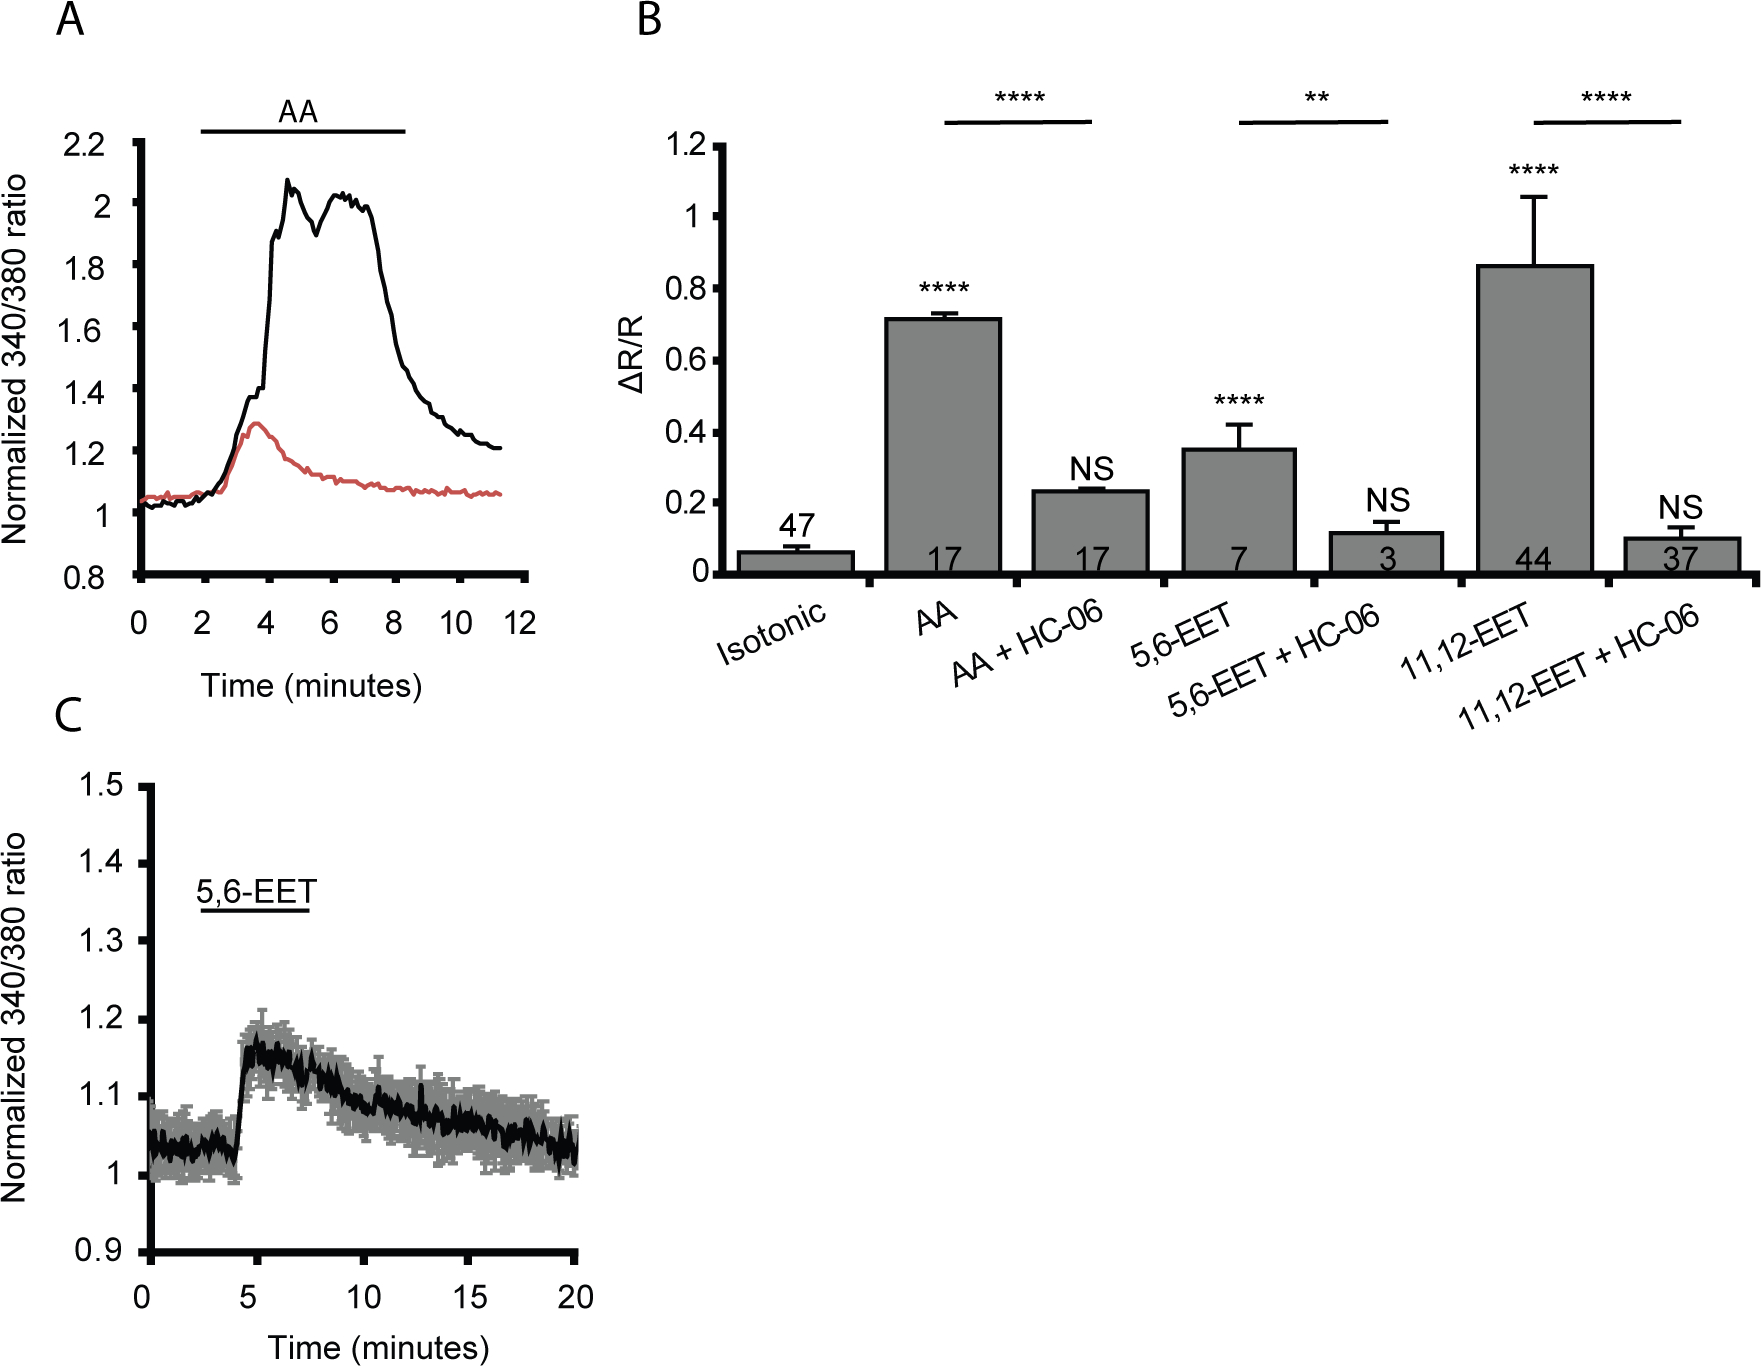
Figure 5. TRPV4 activation in microglia is dependent, in part, on the activation of arachidonic acid’s metabolic cascade into epoxyeicosatrienoic acids (EETs).

(A) Representative trace of a dissociated microglial response to arachidonic acid (AA, black trace) or arachidonic acid + HC-06 (red trace). (B) Quantification of the change in 340/380 ratio in response to AA or its metabolites, 5,6-ET and 11,12-EET alone or administered with HC-06 (n = 3–47). Numbers inside bars represent the number of cells examined in each condition. (C) Average trace of dissociated microglia in response 5,6-EET. All values are represented by mean ± S.E.M. Statistical significance was determined with a Kruskal Wallis test with Dunn’s test for multiple comparisons, NS = not significant, ** p < 0.01, **** p < 0.0001. Unless otherwise indicated statistical significance is compared to the isotonic condition.
