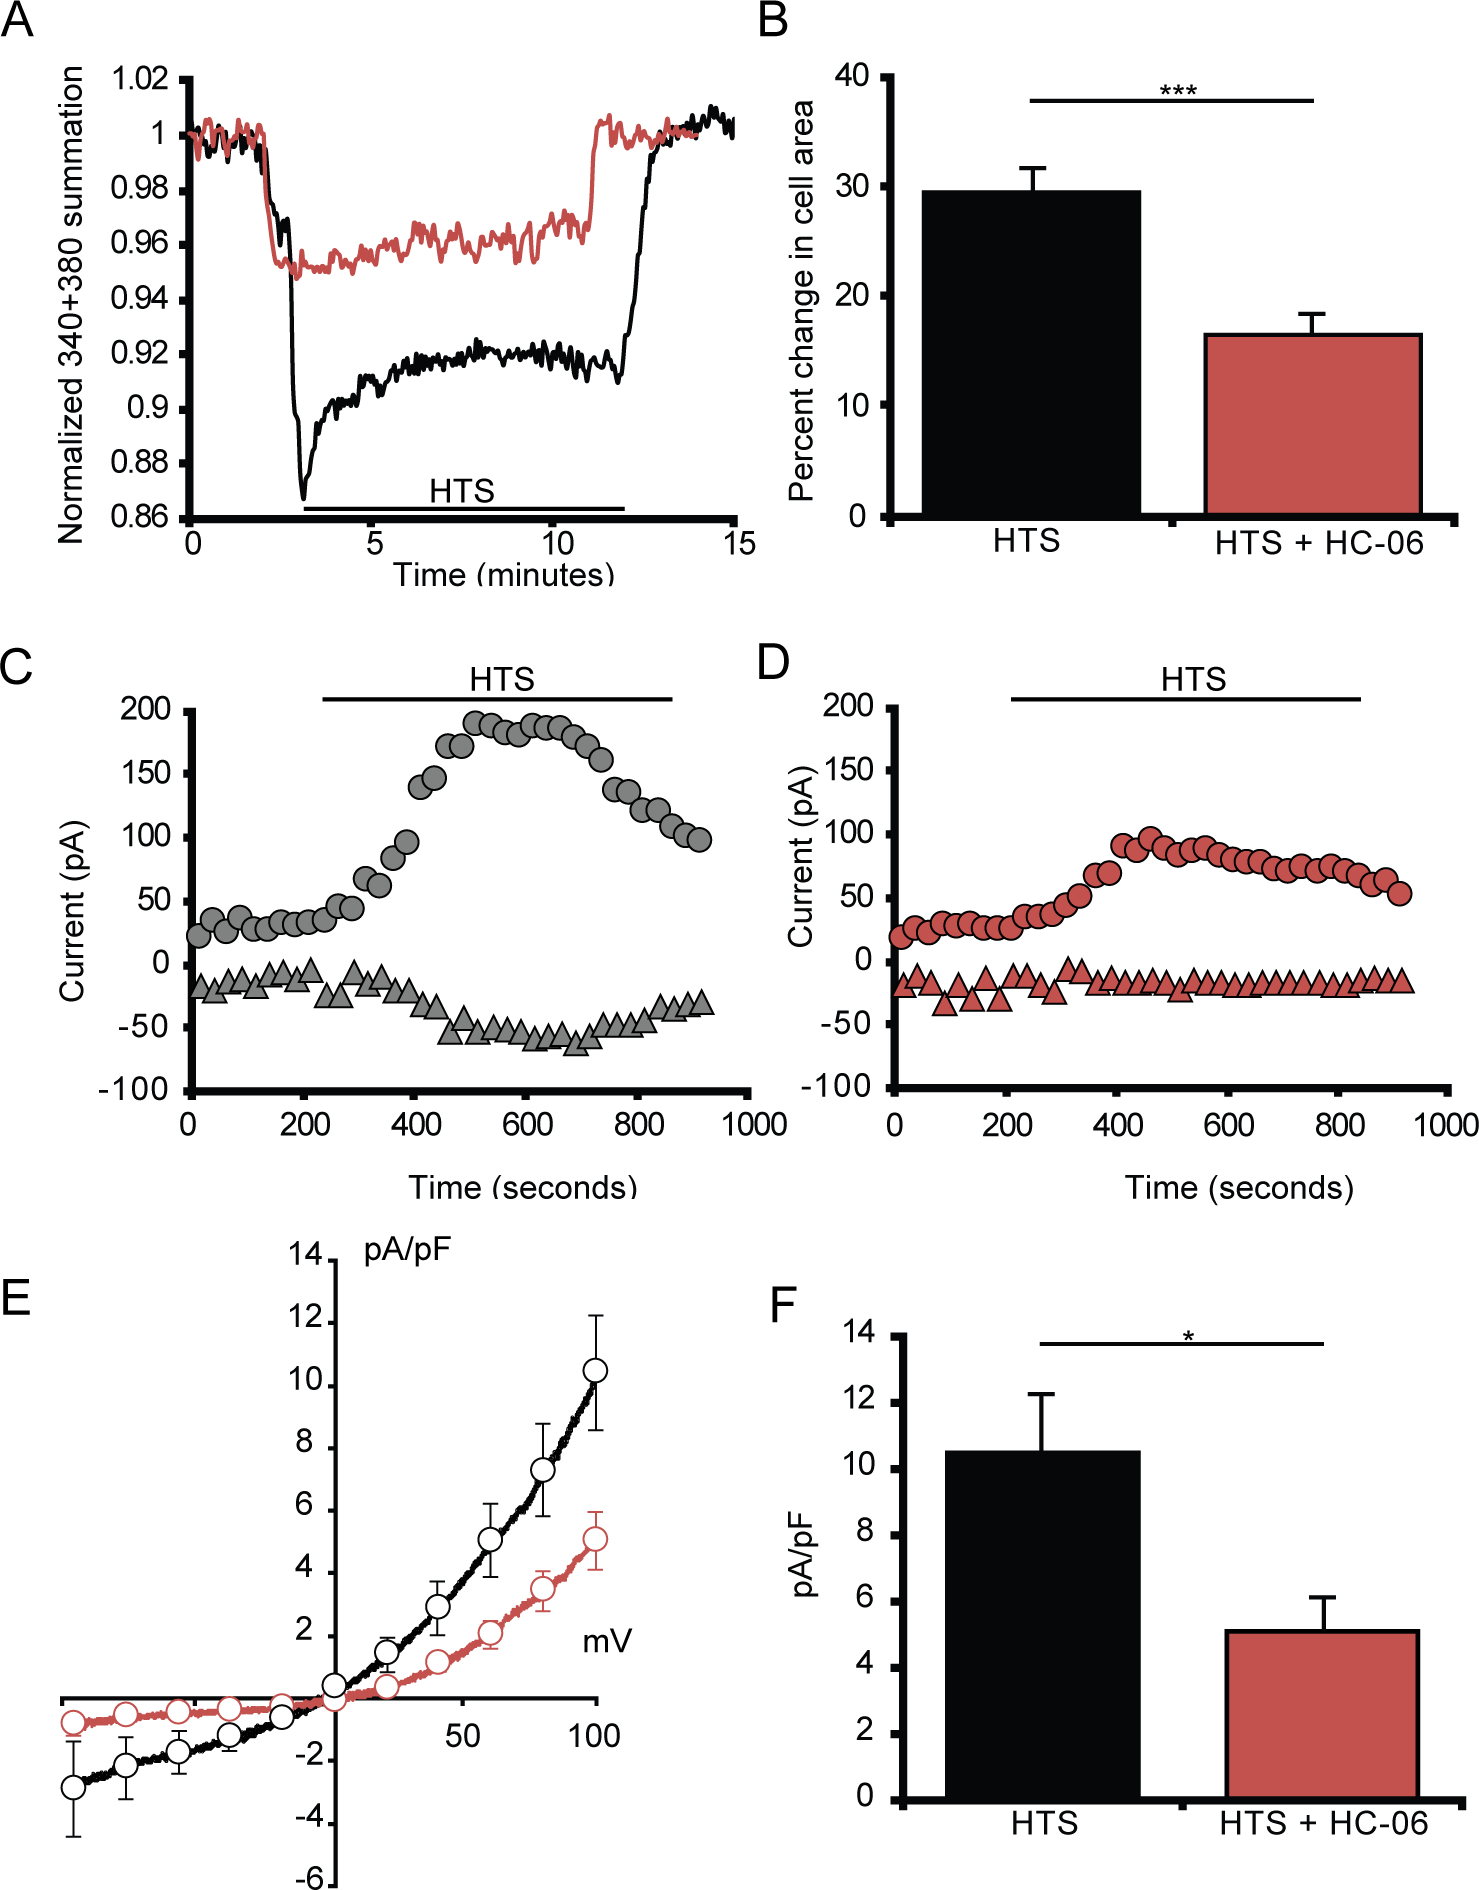
Figure 6. Dissociated microglia swell and exhibit cation currents when exposed to HTS.

(A) Dissociated microglia swell in response to HTS before undergoing regulatory volume decrease. (B) Quantification of the change in microglia volume when exposed to either HTS alone (n = 13) or HTS in the presence of HC-06 (n = 9) from isotonic conditions. (C-D) Representative time course of whole-cell currents in microglia exposed to HTS either alone (C) or pretreated with HC-06 (D) at 100 mV (circles) and −100 mV (triangles) (n = 12). (E) Averaged I-V curve of HTS-induced currents in microglial cells either untreated (black trace) or treated with HC-06 (red trace). HTS-induced currents were obtained by subtraction of the currents before HTS application from the currents at the maximum response to HTS. (F) Quantification of HTS-induced currents in microglial cells exposed to HTS with and without HC-06 (baseline currents were subtracted). Shown are the current amplitude values at 100 mV. All values are represented as Mean ± S.E.M. Statistical significance was determined with an unpaired t-test (B) or paired t-test (F), * p < 0.05, *** p < 0.001.
