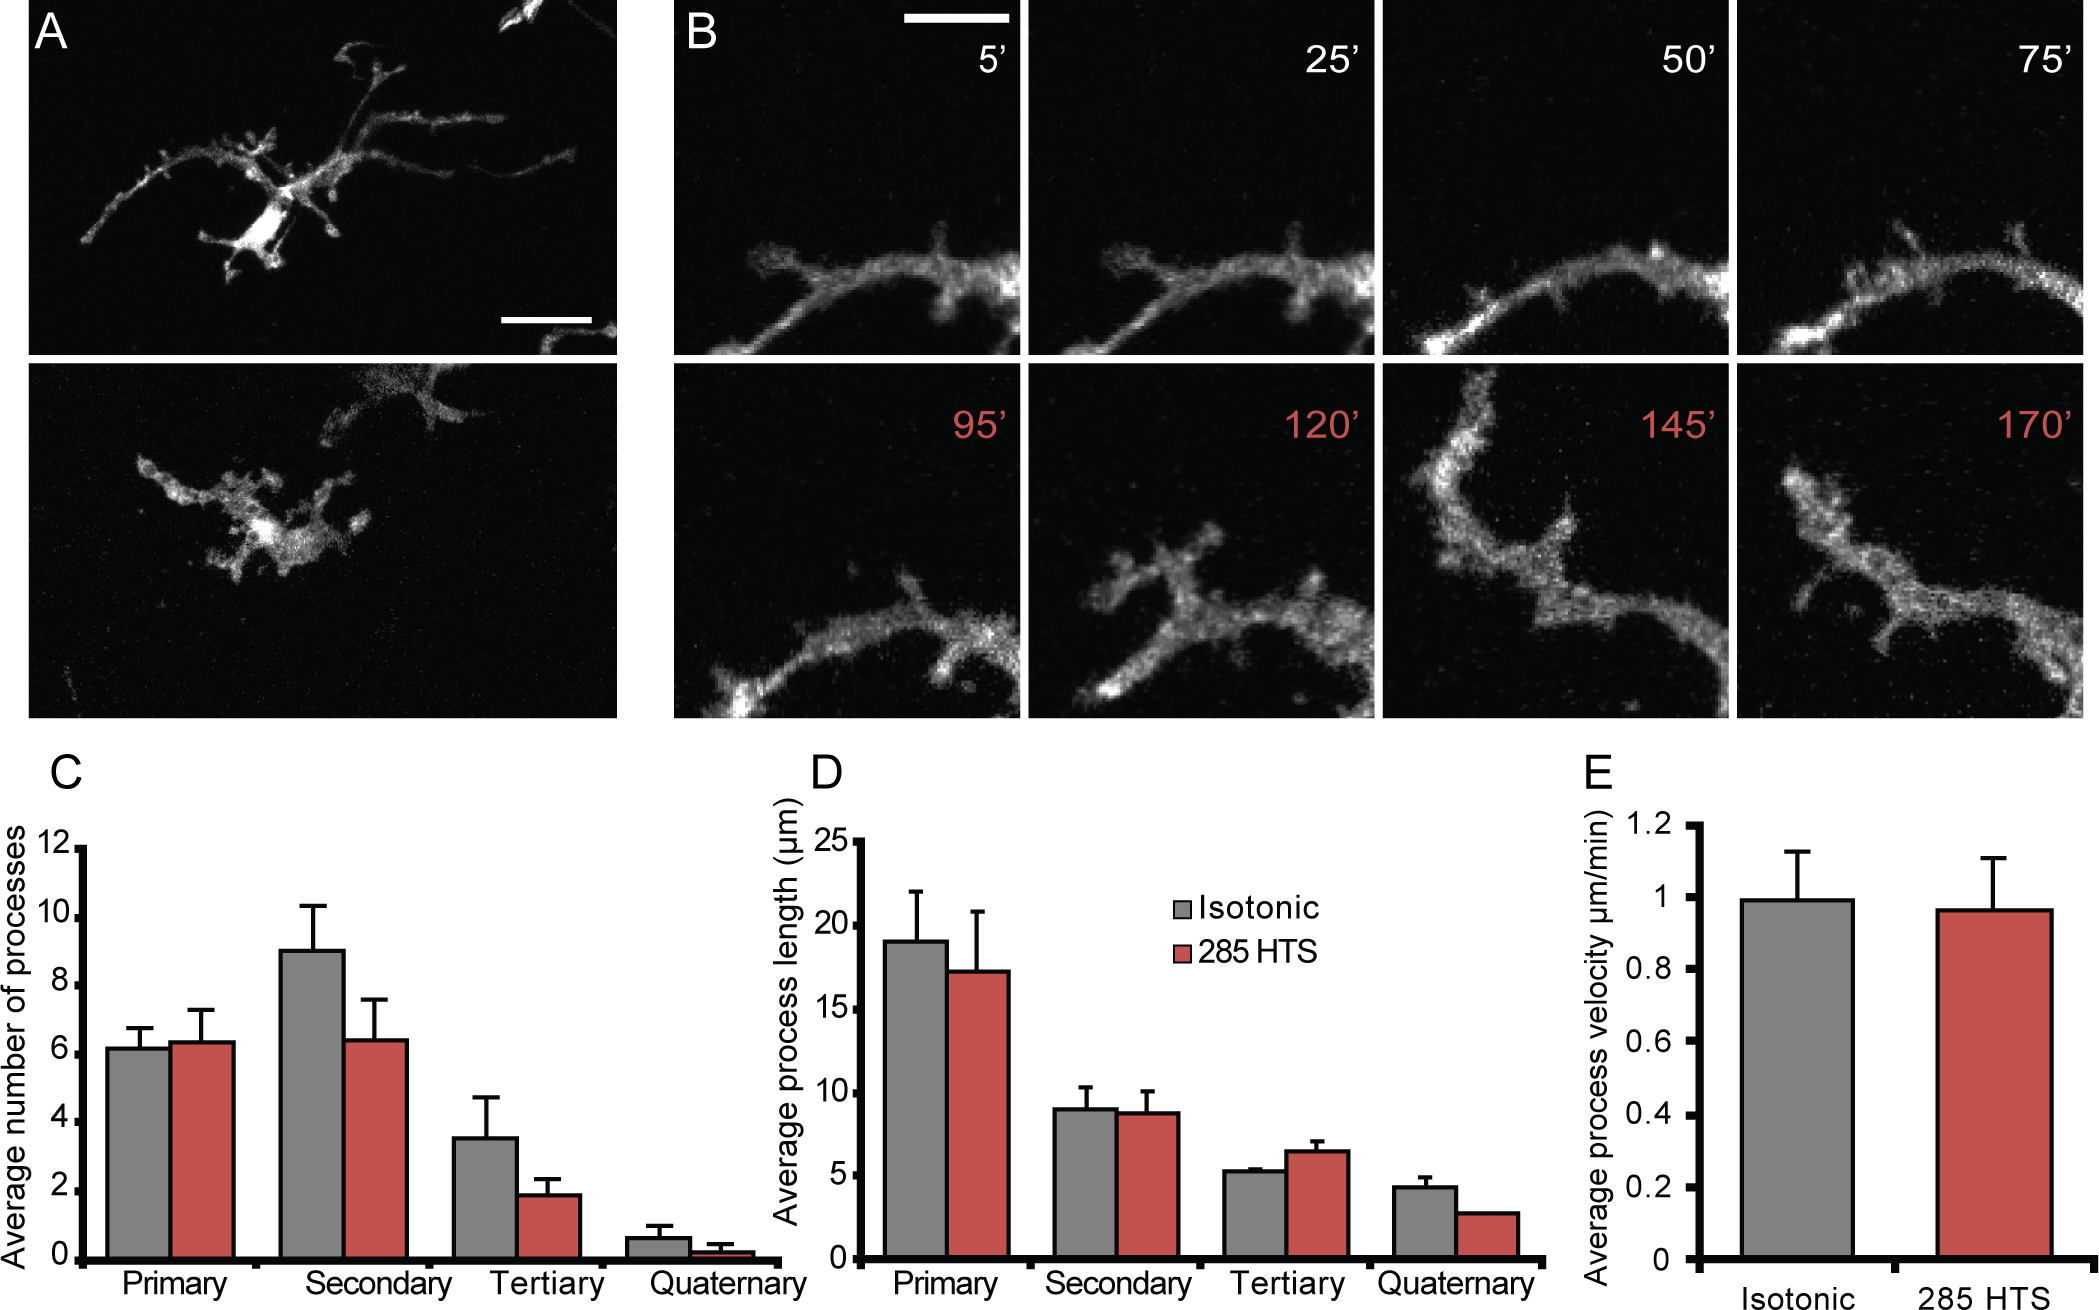
Figure 8. Decreasing the osmolarity by 5% induces subtle morphological changes in retinal microglia.

(A) Representative morphology of a retinal microglia imaged ex vivo when bathed in isotonic (top) or hypotonic (bottom). (B) Representative time-lapse 2P recording of a retinal microglial process during isotonic (white) or hypotonic (red) stimulation. (C-D) Quantification of the average number of processes per microglia (C) and average process length (D) during isotonic (n = 7), 285 mOsm hypotonic stimulation (n = 7), or 285 mOsm + HC-06 (n=5). Scale bar is 20 μm in A and 5 μm in B. All values are represented as mean ± S.E.M. Statistical significance for C and D was determined with a two-way ANOVA with Holms-Šídák’s test for multiple comparisons. NS = non-significant, * p < 0.05, ** p < 0.01, **** p < 0.0001.
