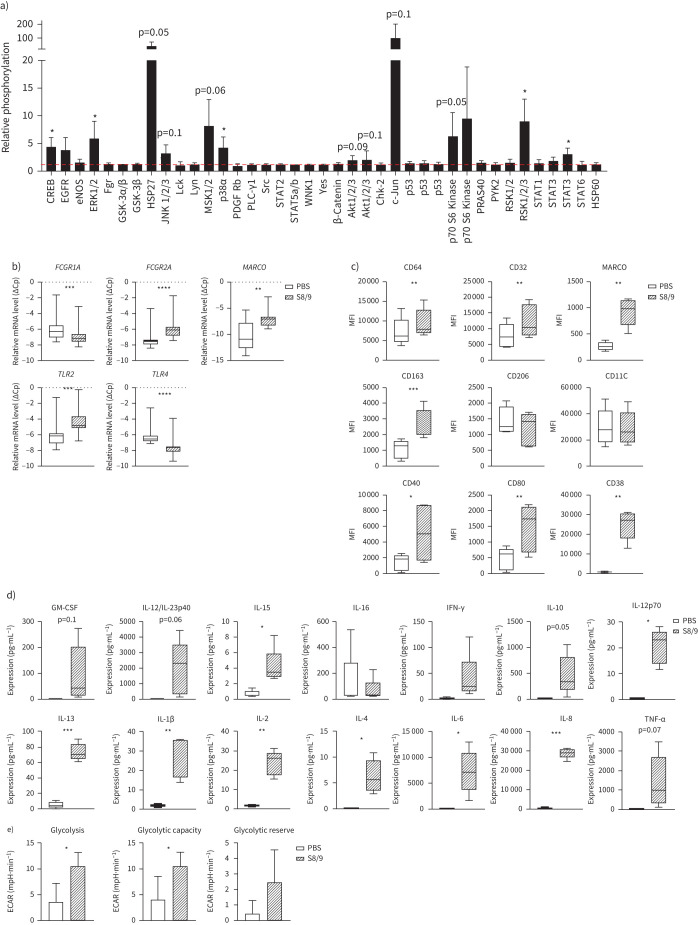
FIGURE 5.
S100 calcium binding protein A8/S100 calcium binding protein A9 (S100A8/A9) modulates macrophage phenotype and metabolism. a) Phosphorylation status of signalling molecules upon 30 min S100A8/A9 (5 µg·mL−1) treatment depicted as fold-difference relative to PBS-induced phosphorylation (n=3). Influence of S100A8/A9 on phosphorylation was calculated using a one-sample t-test. b) mRNA expression of FCGR1A, FCGR2A, MARCO, TLR2 and TLR4 in human monocyte-derived macrophages (MDMs) exposed to PBS or S100A8/A9 (5 µg·mL−1) for 6 h. Relative gene expression, expressed as crossing point change (ΔCp=Cp for GAPDH−Cp for gene of interest) is presented as a mean (n=11). c) Expression of surface markers (CD64, CD332, MARCO, CD163, CD206, CD11C, CD40, CD80 and CD38) presented as geometric mean fluorescence intensity (MFI) on MDMs exposed for 24 h to PBS or S100A8/A9, measured by flow cytometry (n=5). d) Expression of cytokines (pg·mL−1) in supernatants from MDMs exposed to PBS or S100A8/A9 for 24 h. Data are presented as a mean (n=5). e) Glycolysis stress test: glycolysis, glycolytic capacity and glycolytic reserve in MDMs upon PBS or S100A8/A9 exposure for 24 h, presented as a mean (n=3). Impact of S100A8/A9 calculated using paired t-test; *: p<0.05; **: p<0.01; ***: p<0.001; ****: p<0.0001.

