
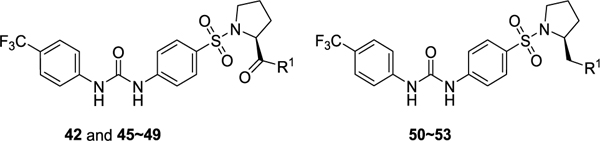
Table 3.
Residual Activity Rates of Series III Compounds on Poly(I:C)-Induced Expression of Inflammatory Genes CIG5 and IL-6 in hSAECsa
| |||
|---|---|---|---|
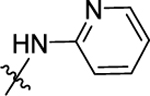
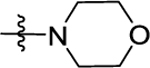
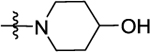
| Compd | R1 | CIG5 (%) | IL-6 (%) |
| 11 | OMe | 2.19 ± 0.16 | 3.42 ± 0.30 |
| 42 | NH2 | 22.6 ± 1.55 | 12.7 ± 1.01 |
| 45 |
|
0.62 ± 0.005 | 13.7 ± 1.06 |
| 46 |
|
4.58 ± 0.33 | 23.7 ± 2.15 |
| 47 |
|
5.47 ± 0.41 | 6.63 ± 0.48 |
| 48 |
|
1.12 ± 0.09 | 32.8 ± 2.84 |
| 49 | -OH | 214 ± 17.1 | 25.3 ± 2.13 |
| 50 | -OH | 0.39 ± 0.03 | 1.71 ± 0.13 |
| 51 | -OTs | 0.63 ± 0.05 | 6.98 ± 0.63 |
| 52 |
|
0.34 ± 0.025 | 0.35 ± 0.03 |
| 53 |
|
0.21 ± 0.02 | 0.40 ± 0.03 |
a
Residual activity rates (%) of tested compounds (at the final concentration of 10 μM) comparing to the positive control group (poly(I:C) alone, at 100%) are presented as the average from three independent measurements (mean ± SD, n = 3).