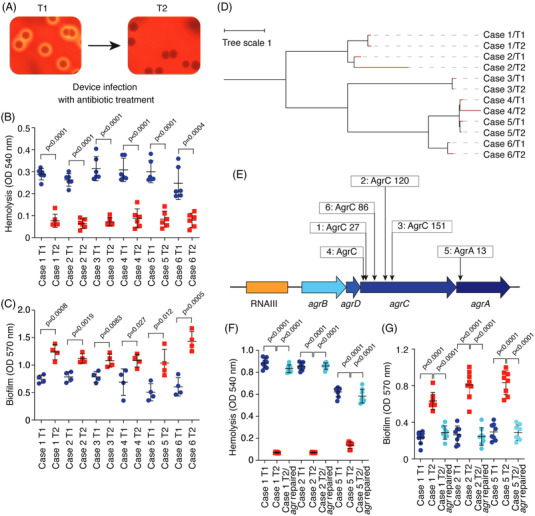
FIGURE 1.

Biofilm‐increasing agr mutations develop during surgical implant infection. (A) Example of corresponding initial (T1) and secondary (T2) isolates analyzed on sheep blood agar plates. (B) Hemolytic capacities of T1 and T2 isolates from the six studied clinical cases. Hemolytic activities of bacterial culture filtrates from cultures grown for 15 h in tryptic soy broth were determined by incubation with human red blood cells for 1 h at 37°C and measuring the optical density at 540 nm. n = 6/group. (C) In vitro biofilm formation of the same isolates as in (B). Biofilms were grown in tryptic soy broth supplemented with .5% glucose for 48 h in 96‐well microtiter plates. Biofilm formation was measured using absorption at 570 nm after crystal violet staining. n = 4/group. (D) Relatedness of isolates. The tree was generated using the whole genome alignment 21.0 plugin to the QIAGEN CLC Genomics Workbench. It was constructed using the method of neighbor joining, which is well‐suited for trees with varying rates of evolution (since there are different ST types). The reference genome is ST398S0385. (E) Location of the non‐synonymous mutations in the agr locus detected in the T2 isolates. Numbers refer to amino acid positions in the encoded proteins. (F and G) Repair of agr mutations in T2 isolates. Hemolysis (F) and biofilm formation (G) of T1, T2 and repaired T2 isolates is shown. n = 8/group. (B and C) Statistical analysis is by two‐tailed, unpaired t‐tests. (F and G) Statistical analysis is by one‐way analysis of variance with Tukey's post‐tests. All error bars show the mean ± standard deviation (SD)
