Fig. 5.
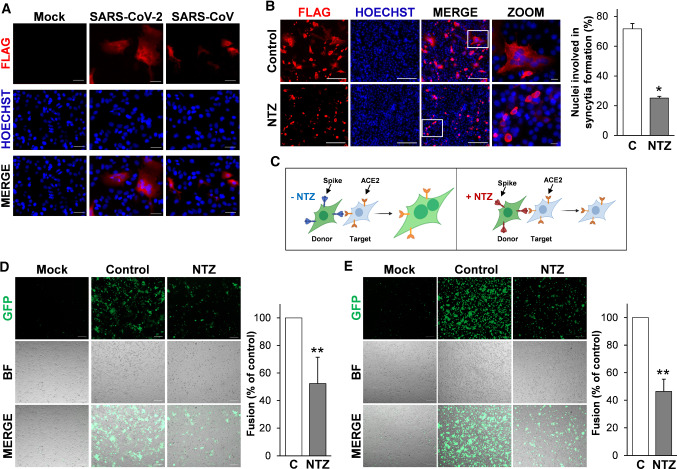
Nitazoxanide inhibits SARS-CoV-2 S-mediated cell–cell fusion. A Syncytia formation by Huh7 cells transfected with the C-terminal Flag-tagged SARS-CoV-2 or SARS-CoV spike constructs or empty vector (Mock) for 40 h were analyzed by immunofluorescence microscopy using anti-Flag antibodies (red). Nuclei are stained with Hoechst (blue). Merge images are shown. Scale bar, 20 μm. B Vero E6 cells transfected with the SARS-2 S-CF construct for 4 h and then treated with NTZ (5 µg/ml) or vehicle (Control) for 36 h were analyzed by immunofluorescence microscopy using anti-Flag antibodies (red). Nuclei are stained with Hoechst (blue). Merge and zoom images are shown. Scale bar, 200 μm (zoom, 20 μm). The number of nuclei involved in syncytia formation is expressed as percent of total nuclei in transfected cells in the same sample (right panel). Data represent the mean ± SD of 5 fields from three biological replicates. *P < 0.05; Student’s t test. C Schematic representation of the donor–target cell–cell fusion assay. D, E HEK293T cells co-transfected with plasmids encoding SARS-CoV-2 S and GFP for 4 h and treated with NTZ (5 µg/ml) or vehicle (Control) for 36 h were overlaid on Vero E6 (D) or Huh7 (E) cell monolayers. After 4 h, cell–cell fusion was assessed by fluorescence microscopy. Bright field (BF) and merge images are shown. Scale bar, 200 μm. Cell–cell fusion was determined and expressed as percentage relative to control (right panels). Data represent means ± SD of three replicates. **P < 0.01; Student’s t test

