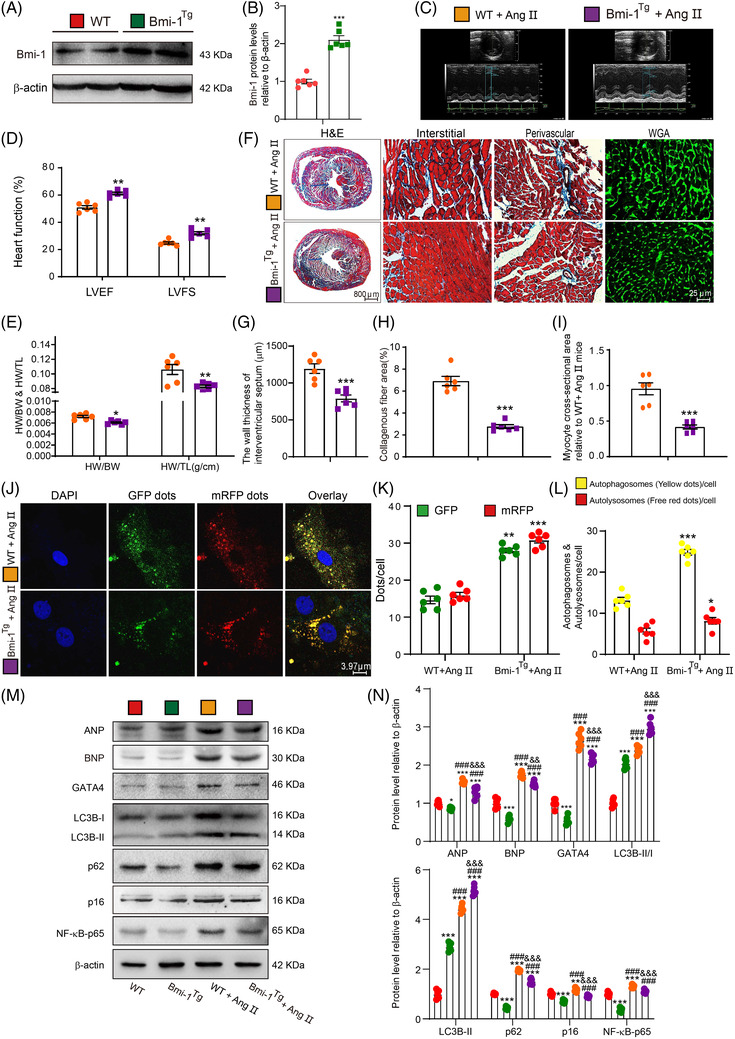
FIGURE 5.

Bmi‐1 overexpression in myocardial tissue represses GATA4‐dependent SA‐PCH by promoting GATA4 autophagic degradation. (A) Western blots for cardiac tissue extracts from 7‐week‐old WT and Bmi‐1Tg mice showing Bmi‐1 protein levels; β‐actin was the loading control. (B) Protein levels relative to β‐actin were assessed by densitometric analysis. (C–D) After treatment with Ang II (1.3 mg/kg/day) for 4 weeks, colour Doppler echocardiography was conducted for 8‐week‐old WT and Bmi‐1Tg mice. (E) Heart weight relative to body weight (HW/BW) and heart weight relative to tibia length (HW/TL). (F) Haematoxylin‐eosin (H&E), wheat germ agglutinin (WGA) and Masson's trichrome (Masson) staining. (G) The wall thickness of interventricular septum. (H) Collagenous fibre area. (I) Myocyte cross‐sectional area was calculated relative to Ang II‐treated WT mice. (J) Representative confocal micrographs of WT and Bmi‐1Tg MECs after autophagy lentivirus transfection for 24 h, with DAPI for nuclei. (K) Percentage of GFP‐ or mRFP‐positive dots relative to total cells. (L) The number of autophagosomes and autolysosomes per cell. Six mice per group were used for experiments. Cell experiments were performed with three biological repetitions per group. Statistical analysis was performed with unpaired Student's t‐test; values are mean ± SEM from six determinations per group, *p < .05, **p < .01, ***p < .001 compared with WT group. (M) Western blots for cardiac tissue extracts showing ANP, BNP, GATA4, LC3B, p62, p16, and NF‐κB‐p65; β‐actin was the loading control. (N) Protein levels relative to β‐actin were assessed by densitometric analysis. Statistical analysis was performed with one‐way ANOVA test. Six mice per group were used for experiments. Values are mean ± SEM from six determinations per group, *p < .05, **p < .01, ***p < .001 compared to WT group; ### p < .001 compared to Bmi‐1Tg group; && p < .01, &&& p < .001 compared to Ang II‐treated WT group
