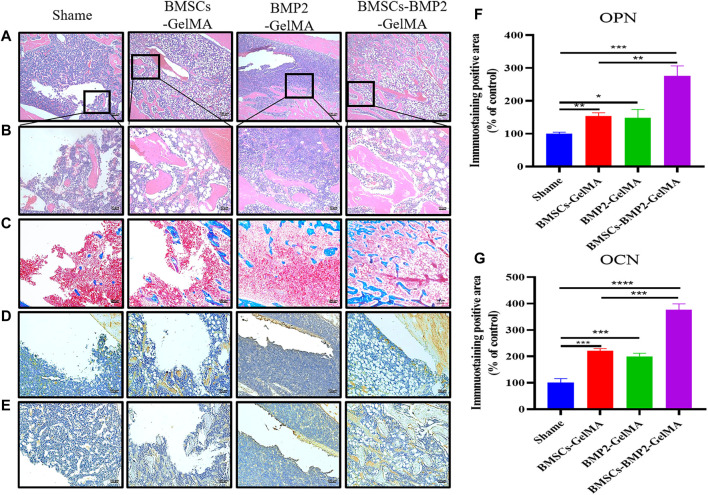
FIGURE 7.
HE staining (A) (bar = 200 μm), (B) (bar = 50 μm) and Masson’s trichrome staining (C) (bar = 100 μm) images of bone defects 8 weeks after implantation of respective scaffolds. Immunohistochemical staining of OPN (D) (bar = 100 μm) and OCN (E) (bar = 100 μm) in rat femoral defect area 8 weeks after implantation of scaffolds. Quantitative analysis of particles with Immunohistochemical staining of OPN (F) and OCN (G).

