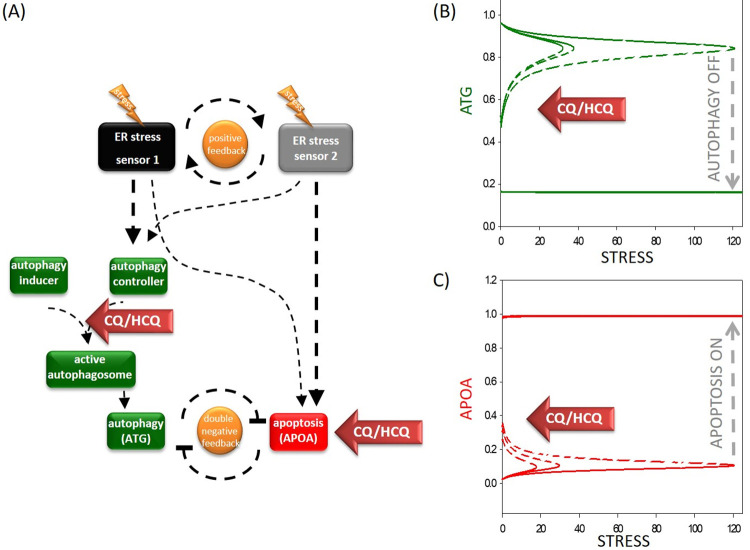
Fig 2. The simple network of autophagy-dependent survival upon chloroquine treatment during cellular stress.
(A) The wiring diagram of the response mechanism. The active form of the ER stress sensor 1 and 2, autophagy inducer, autophagy controller, active autophagosome, ATG and APOA are grouped together in isolated coloured boxes. ATG represents the active form of autophagy activator complex, while APOA represents the active form of apoptosis. Dashed lines show how the molecules can influence each other. Blocked end lines denote inhibition. Red arrows labelled with “chloroquine” show where the drug treatment affects the control network, while yellow “thunders” symbolize the cellular stress. The signal-response curves of (B) survival process and (C) cell death process are shown with respect to increasing stress level. On the “x” axis the stress level, while on the “y” axis the relative activity of (B) ATG or (C) APOA are plotted. Solid lines denote stable state, while dashed line denotes the unstable state of the control network at a given stress level. Grey dashed arrows depict the threshold for autophagy inactivation / cell death activation. Red arrows labelled with “chloroquine” show how the signal-response curves are changing according to increasing level of chloroquine (for the code, see S1 File).

