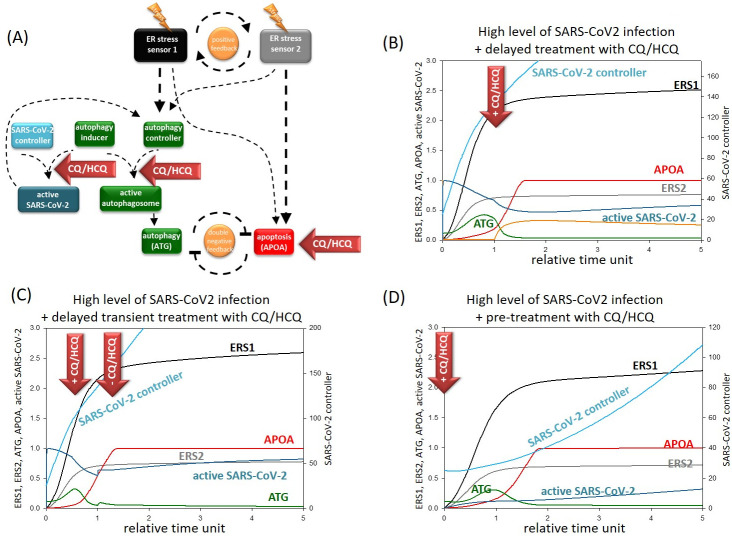
Fig 4. The effect of CQ/HCQ treatment upon severe coronavirus infection.
(A) The wiring diagram of the response mechanism with CQ/HCQ treatment in the presence of SARS-CoV2. The active form of the ER stress sensor 1 and 2, autophagy inducer, autophagy controller, active autophagosome, SARS-CoV-2 controllers, active SARS-CoV2, ATG and APOA are grouped together in isolated coloured boxes. ATG represents the active form of autophagy activator complex, while APOA represents the active form of apoptosis. Dashed lines show how the molecules can influence each other. Blocked end lines denote inhibition. Red arrows labelled with “chloroquine” show where the drug treatment affects the control network, while yellow “thunders” symbolize the cellular stress. The temporary profile of computational simulation of delayed (B) permanent or (C) transient treatment with CQ/HCQ or (D) pre-treatment with permanent CQ/HCQ upon severe coronavirus infection. In case severe infection CVCT (the initial conditions of SARS-CoV-2 controller) is set to 25, while chloroquine treatment was induced by setting CHL = 0.0001 (for the code, see S1 File). The relative activity of ER stress sensor 1 (ERS1), ER stress sensor 2 (ERS2), SARS-CoV-2 controller, form of active virus, ATG and APOA is plotted.

