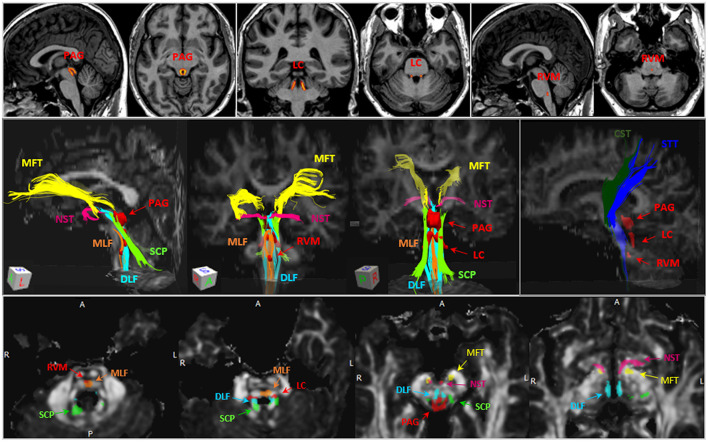
Figure 3.
Illustration of ROI where the volumes of the brainstem nuclei and diffusion metrics were measured. Upper panel, Illustration of ROIs of the PAG, LC and RVM, which were delineated based on literature (108). The hot color scale represents probability of gray matter density (brighter color refers to higher gray matter density) within the ROIs. Middle panel, example of brainstem tracts of interests, including MLF (orange), DLF (cyan), SCP (green), NST (dark pink), MFT (yellow), CST (dark green), STT (blue), and the three brainstem nuclei (red). Lower panel, the anatomical relationships between brainstem tracts (non-red) and nuclei (red) on 4 brainstem axial slices. PAG, periaqueductal gray; LC, locus coeruleus; RVM, rostral ventromedial medulla; MLF, medial longitudinal fasciculus; DLF, dorsal longitudinal fasciculus; SCP, superior cerebellar peduncle; NST, nigrostriatal tract; MFT, medial forebrain tract; CST, corticospinal tract; STT, spinothalamic tract.

