Abstract
In this study, we propose an HIV-TB co-infection model by considering the treatment provision limitation induced by recent COVID-19 pandemic that impacts this dual epidemic immensely, assimilating the significance of educational attempts. We analyze the model and its submodels with single infections individually. We obtain the awareness-induced basic reproduction numbers and discuss the global stability of disease-free equilibrium when provision limitation is zero. We observe that the submodels exhibit forward as well as backward bifurcations under provision restriction. Further, we derive thresholds for resource limitations regulating the dynamical behavior of the systems while analyzing the stability of endemic equilibrium of the models with single infections. Sophisticated simulation approaches are implemented to discover the influences of provision-restricted medication and awareness on dual epidemic. Our findings convey the persistence of co-infection though the basic reproduction number is below unity, if the provision restriction remains uncurbed. An observable insight is that, in spite of having epidemic threshold less than unity and no limitation in TB treatment, co-infection relapses and persists in the population, when there is no awareness attempt. Numerical findings emphasize the urgent need of increased treatment accessibility and importance of awareness in the current situation. Moreover, an optimization problem incorporating treatment and awareness controls is formulated and solved to find the ideal strategy to manage HIV-TB co-epidemic that recommends to diminish the medical resource limitation to get the enormous impact in dominating the adversity caused by COVID-19.
Keywords: HIV-TB dual epidemic, Provision limitation, Educational attempt, Awareness-induced basic reproduction number, Optimal control, COVID-19
Introduction
Acquired immunodeficiency syndrome (AIDS) is a chronic assuredly intimidating condition caused by human immunodeficiency virus (HIV). HIV enfeeble human immune system by attacking and destroying CD4 cells that creates difficulty for the body to fight off infectious diseases and makes a person more vulnerable to other infections. If left untreated, HIV gradually demolishes the immunity structure and makes progress to AIDS. It can be transmitted only through contact with HIV-infected body fluids during unprotected sex or by sharing injection drug equipment or via HIV-contaminated blood transfusion or while pregnancy. Antiretroviral therapy (ART) is used to treat HIV infection, that protects the immune system and intercepts HIV infection from advancing to AIDS and reduces the risk of HIV transmission, as infected people with undetectable viral load ( copies/ml blood) have effectively no probability of transferring HIV. Around the globe, an estimated 37.7 million people are infected with HIV [1].
TB (Tuberculosis) is a terrifying infectious bacterial disease, caused by mycobacterium tuberculosis. It is an airborne disease, as the bacteria spread by airborne respiratory droplets of an infectious individual while coughing or sneezing or can also be transmitted by saliva [2]. There are two conditions of TB infection, latent TB and active TB. In latent condition, TB bacteria exist within the body in a less quantity, so the immune system remains under control and do not cause any symptom. If latent TB endures untreated, it becomes fatal TB disease which is highly infectious. TB is curable with antimicrobial drugs [3]. Globally, an estimated 7.1 million people were reported to have been diagnosed in 2019, 9.96 million people got infected with TB in 2020, and 63 million lives were saved through TB diagnosis and treatment during 2000–2019 [4].
TB is synergistically related to HIV/AIDS where each augment the dreadfulness of other, and it can assuredly be a murderous combination which is capable of causing deaths if remains untreated. HIV-infected people are 30 times more presumably to get TB infection than a typically healthy person. A people infected with latent TB is able to develop active TB at least 10 times more in the presence of HIV. TB disease is more vulnerable to HIV-infected individuals because of their weakened immune system. An HIV-TB co-infection can accelerate the progression from HIV to AIDS. In 2020, an estimated 12.6 million people are co-infected globally [1, 3]. The medications for HIV and TB combinedly can reduce the menace of co-infection. An HIV-infected person should continue ART in spite of being diagnosed with TB at the same time, but a specific attention should be given to avoid the potential drug interaction between ART and TB drugs. Isoniazid preventive therapy (IPT) is the most impactful medical support to HIV patients for preventing the progression from latent to active TB and reinfection. Around 4.1 million people are provided TB preventive treatment worldwide in 2019; among them 3.5 million are surviving with HIV. But, in developing countries like India and South Africa, the recent rates of getting TB preventive medications are 25 and 18%, respectively, which are not much satisfactory [4]. Moreover, some evidences show that ART can also prevent HIV-infected humans from acquiring TB disease by 70–90% [5]. In case of co-infection, it is necessary to start implementing ART as early as possible without detaining it until the completion of TB treatment as this strategy causes higher mortality rate [6]. Patients with HIV-TB co-infection acquire 1.8 times higher probability of death than a singly infected person [7]. HIV-TB combinedly impose an enormous burden on public healthcare system and place specific diagnostic and medicinal challenges, especially in countries facing scarcity of resources. “End TB Strategy” by WHO targeted 20% reduction in TB incidence rate and 35% decrement in number of TB-induced deaths. But, it came across as only 9 and 14%, respectively, in which lack of awareness and treatment provision limitation contribute a lot. Nearly 14 million humans are victims of this dual epidemic worldwide and 86–90% of them are dense in high TB-HIV-loaded countries [8].
HIV-TB dual pandemic is exercised by numerous mathematical models [9–12]. Gakkhar and Chavda [13] showed that coexistence of HIV-TB cannot remain longer in population in spite of having basic reproduction number greater than unity, single disease can persist only. Agusto and Adekunle [14] studied an optimal control model considering two strains of TB (drug-sensitive and drug-resistant) to examine the effect of different control strategies. They showed that combined strategy including prevention of treatment failure in case of drug-sensitive TB and treatment of drug-resistant TB is the most effective one. Mallela et al. [15] analyzed a model to examine early and late treatment of HIV during TB treatment in case of co-infection, impacting new infection, HIV-related deaths and IRIS cases. Awoke and Kassa [16] formulated an optimal control model by taking into account prevalence depending behavior change incorporating treatment. They showed that combination of prevention and treatment is the best impactful optimal strategy. There are also some mathematical models on HIV-TB co-infection involving resource limitation matter. It can be noted that in all the aforementioned models, the treatment rate has been taken as constant following Holling type-I function. In [17], authors have investigated an SIR model, where they have taken the treatment rate as Holling type-II functional response. Dubey et al. [18] considered Holling type-III and type-IV treatment rates in an SEIR model. In [19], authors have studied an SIR model by introducing Beddington–DeAngelis-type function as incidence rate together with Holling type-II treatment rate. Various modeling approaches have been introduced in some recent research papers [20–22].
COVID-19 pandemic has impacted the socio-economic structure badly; one of its unavoidable circumstances is disruption in medical resources. Noticeable retardation is found in TB medication encompassing preliminary care to hospitalization due to limited provision in health workers, medicines, pharmaceutical structure, finances, etc. Lockdown and public health protocols of COVID-19 situation implement tough challenges on conventional TB management. This restrictions can lead to a 13% increase of TB deaths [23]. According to WHO’s survey, it has been directed onwards in International AIDS Society’s (IAS) biannual conference that 73 countries are facing huge crisis because of the unavailability of antiretroviral medicines due to COVID-19 pandemic and 24 countries are identified as having an immensely feeble stock or upsetting supply of life-saving ARV drugs. A modeling investigation by WHO and UNAIDS predicted that a half-year disturbance in HIV medication service could double AIDS-induced mortality in Sub-Saharan Africa. Close-down of transportation hampers the suppliers of ARVs to reach the destination and COVID-19 pandemic situation causes limited access to medical service. Thus, the most needy people are unable to get prevention and testing facilities. Due to this, global target to suppress HIV is impeded as the estimated yearly new infections has been fastened at 1.7 million since last two years. There seems low-key reduction in HIV deaths from 7,30,000 in 2018 to 6,90,000 in 2019 [24]. Apparently, HIV-TB dual epidemic is directly impacted by COVID-19 situation. Thus, it is highly essential to take into consideration the provision limitation of HIV and TB treatment. That is why, we introduce saturated treatment rates in our model following Holling type-II functional response. Moreover, awareness plays a vital role in managing this dual epidemic by limiting risky behavior of susceptible individuals, especially in case of provision restriction situation. Almost 19% HIV-infected persons don’t even know their condition [25]. It is very unfortunate that a lot of people surviving with HIV lead to TB related death and a huge portion of them don’t even know their status or are not enough aware to start proper co-infection treatment within right time [26]. This necessitates enough awareness attempt to educate people about HIV, TB and most importantly to make them aware of preventive mechanism, diagnostic and pharmaceutic interventions to manage HIV-TB co-infection.
The model formulation
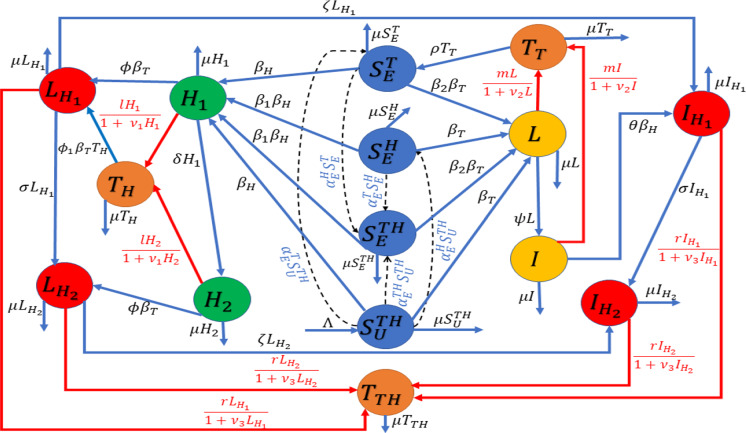
The main purpose of our present investigation is to advert the disruption of HIV-TB service ascribed to COVID-19. For this purpose, a fifteen-dimensional deterministic HIV-TB co-infection model has been formulated absorbing nonlinear treatment rate and awareness. At any time , let the total number of population per unit area in a considered domain be N(t). The whole population is classified into fifteen mutually disjoint divisions (including four susceptible cohorts) viz. susceptible human population uneducated about HIV/AIDS and TB both, ; susceptible human population educated about HIV/AIDS only, ; susceptible humans educated about TB only, ; susceptible humans educated about HIV/AIDS and TB both, ; HIV-infected human population, ; AIDS-infected human population, ; latent TB-infected human population, L; active TB-infected human population, I; HIV-infected human population who are coinfected with latent TB, ; AIDS-infected human population who are coinfected with latent TB, ; active TB-infected human population who are coinfected with HIV, ; active TB-infected human population who are coinfected with AIDS, ; human population treated for HIV/AIDS only, ; human population treated for TB only, ; human population treated for HIV/AIDS and TB both, . We formulate our HIV-TB mathematical model based on the following assumptions.
Uneducated susceptible class has recruitment at a constant rate , and the recruited individuals are completely unaware of these two diseases.
Uneducated susceptible individuals are consuming HIV education at a rate , TB education at a rate and education about HIV-TB co-infection at a rate , thereby moving to , and cohorts, respectively. HIV-educated susceptible humans can move to class by consuming TB education and similarly TB-educated individuals are capable to progress in class by consuming HIV education. Here, , and are information propagation rates for HIV, TB and HIV-TB co-infection, respectively; , and are the densities of educational attempts; and , and represent time-consuming parameters in case of awareness about HIV, TB and co-infection, accordingly.
- Susceptibles who are completely uneducated about HIV (i.e., and ), acquire HIV infection by unmediated contact with HIV/AIDS-infected population including co-infected individuals at an effective infection rate,
Since AIDS-infected individuals (including co-infection) are more vulnerable than HIV-infected persons (including co-infection) and infected people treated for HIV are less infectious than HIV infectives comparatively. Thus, we introduce two modification parameters and , accordingly. - Susceptible humans who are unable to consume TB education (i.e., and ) become infected from TB infectives including HIV-TB co-infected individuals at a rate of transmission
Information related to disease aspect changes exposed attitude of humans by adopting non-pharmacological intervention to avert infection. Educated susceptible individuals having knowledge about HIV/AIDS (i.e., and ) will be afflicted with HIV at a reduced rate , where is expressed as the measure of education impact depending on the decreased probability of risky human practice and efficacy of education, i.e., TB disease transmits at a lesser rate , among susceptible humans having TB education (i.e., and ), where with decreased probability of risky human practice toward TB. Here, represents the failure of educational movements.
People with HIV infection can develop AIDS without accessing any medical treatment at a rate and individuals infected with latent TB can progress to active TB infection at a rate , if latent TB is evacuated to be oppressive.
HIV/AIDS is such a lethal disease that increases risk of other contagious diseases like TB by weakening the immune structure of body. As TB is an opportunistic infection, so HIV/AIDS-infected individuals become co-infected with TB at an increased rate . Similarly, TB infection provokes HIV transmission that induces an increased rate for TB-infected persons to acquire HIV infection combinedly, where are modification parameters.
HIV-TB is a deadly combination that can place someone’s life in peril by accelerating each other’s progression in a damaged immune environment of the body. Therefore, HIV-infected individuals who acquire co-infection of TB disease escalate into AIDS at a rate , and co-infected people with latent TB and HIV/AIDS advance to active TB by a rapid activation at an increased rate .
Treatment rates for both HIV and TB are assumed to follow Holling type-II function considering limitation in the medical resources. HIV- and AIDS-infected people are accessing ART at a rate and ( is the initial treatment rate for HIV/AIDS), respectively. Similarly, people with latent TB and active TB are getting treatment at rates and , respectively ( is the initial treatment rate for TB). People co-infected with HIV and TB are assumed to get medical intervention for co-infection at a rate ( represents co-infected classes, i.e., , , and ) with initial treatment rate of co-infection . Here, and indicate the effects of hindrance for HIV and AIDS treatment, accordingly. The impact of restriction in latent TB treatment is indicated by and active TB treatment by . Inhibition impact of co-infection treatment is represented by the term . Here, , and are provision limitation parameters for HIV, TB and co-infection treatments, respectively. Clearly, the treatment rate is an increasing function of infected individuals with continuous differentiability, satisfying following conditions for an infected class : (i) , (ii) , (iii) maximum treatment size.
Individuals are transferred to class at a rate from class by losing their immunity with passage of time. This indicates the possibility of re-infection of individuals recovered from the TB disease. Moreover, individuals treated for HIV/AIDS can be infected with TB at a rate , where (since ART and IPT reduce the risk of getting TB infection while developing co-infection in comparison with untreated HIV/AIDS-infected people).
Per-capita natural mortality rate is in each cohort whereas due to the graveness of diseases there are extra mortalities for the individuals infected with AIDS, TB and HIV-TB co-infection at rates , and , respectively.
In view of the above assumptions, a schematic diagram is depicted in Fig. 1, and we have the following system of differential equations for the HIV-TB coinfection:
| 1 |
Here,
All the variables and parameters related to the model (1) are assumed to be nonnegative as the system dynamic observes human population. System (1) is to be analyzed with nonnegative initial conditions. The epidemiological meanings of parameters describing model (1) are mentioned in Table 1.
Fig. 1.
Schematic
Let us consider the biologically-reasonable domain:
The dynamics of total population N(t) is given by adding all the equations of model (1) to get,
Applying standard comparison theorem [29] and using the initial conditions, we have . Particularly, whenever . Therefore, every solution of the system (1) initiating in remains therein for all . Hence, is a positive invariant and attracting region. It assures the epidemiological and mathematical well-posedness of the system (1) in .
Dynamics of system (1) in the absence of TB
The HIV sub-model of the co-infection system (1) is obtained when human population is not infected with TB disease, i.e., when all the compartments of human population in system (1) other than , , , and are absent. The HIV sub-system, well-posed in a subdomain , is given as follows:
| 2 |
Here,
Disease-free equilibrium (DFE) and its stability
The disease-free equilibrium of HIV-only model can be obtained by equating the right-hand side of system (2) to zero, when the disease does not exist in the population, and it is given by
Therefore, at DFE, we have Now, we derive the expression for basic reproduction number by next-generation matrix approach [30]. The matrices and associated with infection terms and rest of the left transfer terms, respectively, are computed as,
The corresponding Jacobian matrices are obtained, respectively, as
Thus,
Here,
and
Note that produces the awareness-induced basic reproduction number for HIV-only model and is defined as
| 3 |
Here, is the spectral radius of next-generation matrix. Moreover, in the absence of any awareness attempt, the basic reproduction number transforms to , which is given by
| 4 |
Following [30], we have the following theorem.
Theorem 1
The disease-free equilibrium of HIV model (2) is locally asymptotically stable if and unstable if .
Regarding the global stability of disease-free equilibrium , we have the following theorem.
Theorem 2
If the treatment provision of HIV/AIDS has no restriction (), the disease-free equilibrium of HIV model (2) is globally asymptotically stable in for and .
For the proof of this theorem, see Appendix A.
Impact of public health education on
Let be the proportion of individuals educated about HIV/AIDS in disease-free environment. From equation (3), we have
After partially differentiating the above equation, we get
| 5 |
where
As K is always positive, we have the following possibilities:
(1) if (2) if (3) if Actually, is the measure of HIV/AIDS education impact on HIV transmission rate due to the change of hazardous human behavior toward HIV infection. If the efficacy of health education is , reaches the value zero as and , where is the reduced probability of risky human practice. As is always less than unity, . This indicates that health education of HIV has negative impact on effective basic reproduction number . Therefore, the influence of HIV education will be inimical only when the propagation of awareness is not perfect. Again, as , from equations (3) and (4), we have This indicates that proper HIV education always has positive impact in controlling the disease and hence reduces the burden of HIV/AIDS epidemic.
Local stability of endemic equilibrium and bifurcation analysis
The endemic equilibrium point of HIV sub-model (2) is denoted by and is obtained by setting the right-hand side of system (2) to zero, to get
| 6 |
| 7 |
After adding all the equations of system (2), we get
| 8 |
At the endemic equilibrium point, we have
| 9 |
We can find the value of by substituting the values of , , , and in Eq. (8). Now, from Eqs. (6–7), we can obtain and . Moreover, we can derive the force of infection from Eq. (9). For , , , , , the feasibility of endemic equilibrium point is assured. Moreover, the equilibrium is unique if and are determined uniquely from Eqs. (8) and (9), respectively.
We have the following theorem regarding the local stability of endemic equilibrium point .
Theorem 3
The unique endemic equilibrium point exists for and is locally asymptotically stable whenever ; the system (2) exhibits forward bifurcation with bifurcation parameter at . Moreover, there exists a stable endemic equilibrium along with a stable disease-free equilibrium for whenever and system (2) exhibits a backward bifurcation, where is defined in the proof.
For the proof of this theorem, see Appendix B.
Dynamics of system (1) in the absence of HIV/AIDS
The TB sub-model of the co-infection system (1) is obtained when no HIV/AIDS is present in the human population, i.e., when all other classes are zero except , , L, I, , and is given as follows:
| 10 |
Here, System (10) is well-posed in the subdomain .
Disease-free equilibrium and its stability
The disease-free equilibrium point of the model (10) is obtained as
which always exists in the system.
The awareness-induced basic reproduction number for model (10) is obtained, by following next-generation matrix approach [30], as
| 11 |
It is apparent from the expression of that proper TB education always has a positive impact in curbing the disease and it reduces the burden of TB epidemic. In the absence of any educational attempt, takes the form
| 12 |
Thus, we get the following result [30].
Theorem 4
The disease-free equilibrium is locally asymptotically stable if and unstable if .
Regarding the global stability of , we have the following theorem.
Theorem 5
The disease-free equilibrium is globally asymptotically stable (GAS) in for as well as for only when there is no limitation of TB treatment provision, i.e., .
Proof
Let us consider the following Lyapunov function:
where and with Lyapunov derivative,
If TB treatment provision has no limitation, i.e., only when , we must have for .
Therefore, by LaSalle’s Invariance Principle [31], the disease-free equilibrium is globally asymptotically stable only when .
Endemic equilibrium and its local stability
The endemic equilibrium of the model with TB only is , whose components are obtained as follows:
| 13 |
| 14 |
| 15 |
| 16 |
| 17 |
| 18 |
The positive values of and can be determined from Eqs. (13–16). Further, the force of TB infection can be derived from Eq. (18). If the solution of equilibrium equations is unique, it refers to the unique existence of the endemic equilibrium .
Employing center manifold theory (Theorem 4.1 of [32]), we get the following result regarding the local stability of the endemic equilibrium .
Theorem 6
The unique endemic equilibrium point exists for and is locally asymptotically stable whenever , the system (10) undergoes a forward bifurcation at with bifurcation parameter . Further, there exists a stable endemic equilibrium and a stable disease-free equilibrium simultaneously for whenever and system (10) exhibits backward bifurcation, where
Analysis of HIV-TB co-infection system (1)
Disease-free equilibrium and its stability
Disease-free equilibrium of system (1) is obtained as,
The basic reproduction number of system (1) is derived by next-generation matrix method [30]. The awareness-induced basic reproduction number of the co-infection dynamics is obtained as,
| 19 |
If there is no educational attempt about HIV and TB, then is transformed into the following form:
| 20 |
Thus, we get the following result [30].
Theorem 7
The disease-free equilibrium point is locally asymptotically stable if and unstable if .
Global stability of disease-free equilibrium
Following Castillo-Chavez et al. [33], we study global stability behavior of DFE . System (1) can be rewritten as: . Here, and represent the uninfected and infected individuals, respectively. For the global stability of equilibrium , we must have . Here, A represents an M-matrix.
For system (1), and the matrix is computed as
Here, It can be easily noted that . Thus, the second condition for global stability of the equilibrium is violated [33]. Therefore, perhaps the disease-free equilibrium is not globally asymptotically stable.
Optimization problem
The main purpose of constructing and solving the optimization problem is to invent unrivalled strategy to restrain the HIV-TB dual epidemic, instead of applying baseline control technique. Our principal objective is to minimize the number of singly and dually infected individuals along with the cost of executing control measures in a specific time span . Let , and be the control measures associated with the rates of consumption of HIV education, TB education and co-infection awareness, respectively. Further, let , and be the control functions relating to treatment rates, which are the fractions of additional infected people accessing treatments of HIV, TB and co-infection, respectively. The initial awareness consumption rates are considered as , and ; initial treatment rates are assumed as , and . Furthermore, , and indicate the maximum rates of education consumptions. Maximum treatment rates are indicated as , and , accordingly. After applying the aforementioned control measures, system (1) can be reformulated as follows:
| 21 |
The optimization problem is proposed as
| 22 |
where the objective function is given by,
| 23 |
regulated by the state system (21) with the set of permissible control measures such that
Here, , and indicate the expenses for HIV-infected individuals without any symptom of AIDS, symptomatic people with AIDS, active TB-infected individuals, active TB-infected people who also have HIV, and AIDS-infected individuals who have co-infection of active TB, respectively. The cost of HIV treatment, TB treatment and HIV-TB co-infection treatment are represented by and , respectively. , and depict the outlay on HIV educational attempt, TB educational attempt and awareness attempt for co-infection, respectively.
Now, we employ Pontryagin’s Minimum Principal [34] to derive the necessary conditions for the existence of solution of optimization problem, that converts the optimization problem into minimization of the following Hamiltonian with respect to state trajectory , optimal control and corresponding Lagrange multiplier vector :
| 24 |
where is the ith component of Lagrange multiplier .
The first optimality condition is obtained as the minimization of with respect to optimal control measure (). Therefore, we must get Thus, for the optimal control measures, we have
Hence, in the specified bounded interval, the optimal controls are given as
The second condition of Pontryagin’s Minimum Principal gives the adjoint equations as , with the condition (). Now, we can obtain the solution of the optimization problem by solving the above two mentioned conditions along with the state system (21).
Numerical simulations
In this section, we perform extensive numerical simulations to explore the rich dynamics of model (1), and its submodels (2) and (10). We exemplify our analytical findings by commencing the initial conditions , , , , , , , , , , , , , , along with the parameter values given in Table 1. Treatment provision limitations necessitate the assumption of initial treatment rates as 0.62, 0.7 and 0.66 for HIV, TB and co-infection, respectively. Other parameter values are chosen within the epidemiologically feasible range and explained in previously published research papers [16, 28, 35]. Since the co-infection model (1) is a fifteen-dimensional system and hence it is recalcitrant while analyzing mathematically, thus we assess the full model numerically as much as possible.
Influence of some dominant parameters on HIV-TB co-infection
It is worthy to note that the parameter values taken for simulations may have some errors as they are obtained from several experiments. To tame this uncertainty, we perform global sensitivity analysis by implementing two statistical techniques: Latin Hypercube Sampling (LHS) and Partial Rank Correlation Coefficients (PRCCs) [36, 37]. LHS permits to differ various parameters simultaneously in an efficient manner whereas the latter one correlates the model parameters , , , , , , , , , , , , , , l, m and r with the response function by assigning the values between and 1. We have taken the response function as co-infected class . The signs of PRCCs indicate the type of correlation between the input parameters and the response function whereas the values represent the strength of their influences. We run 500 simulations per LHS by considering uniform distributions for each input parameter, and their baseline values are taken from Table 1 with deviations. We observe in Fig. 2 that the parameters , , , , , , , and are positively correlated, and the parameters , , , , , l, m and r are negatively correlated with co-infected class . Model parameters having significant PRCCs are marked specifically by *. The sensitivity results show that boosting up the propagation rates of information about HIV () and TB (), and increasing the accessibility of treatment for co-infection by controlling the provision limitation have significant impacts in suppressing the burden of this dual epidemic.
Fig. 2.
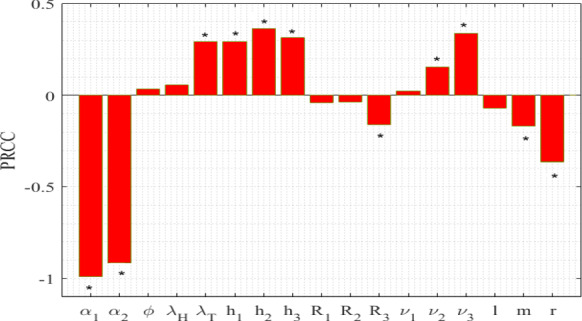
Influence of uncertainty of the model (1) on individuals co-infected with active TB and HIV (). Baseline values of parameters are the same as in Table 1. Model parameters having significant PRCCs are indicated by *
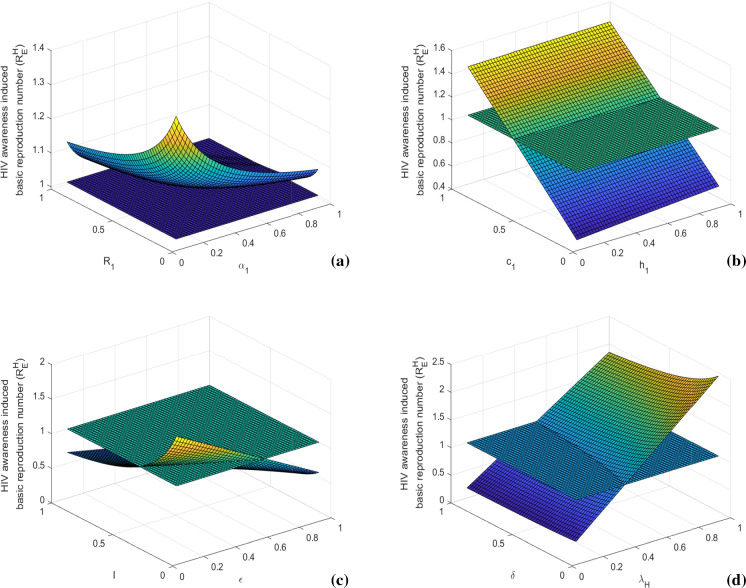
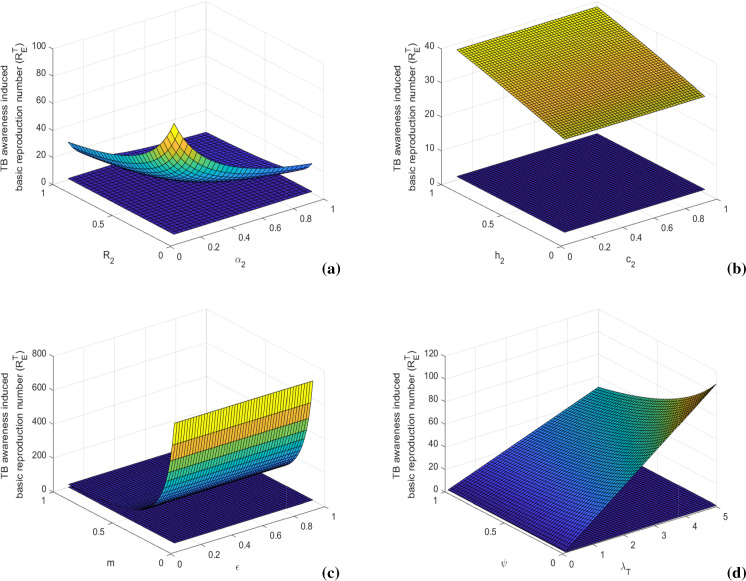
In Figs. 3 and 4, we present sensitivity of awareness-induced basic reproduction numbers of HIV and TB submodels, respectively. In the figures, surface plots represent variations of these basic reproduction numbers with respect to two important model parameters at once. Figure 3 shows that the value of increases with the increase of HIV transmission rate () and HIV to AIDS progression rate (). It can be diminished by reducing the probability of risky sexual practice () and time consumption parameter (). The value of also decreases by increasing the HIV awareness distribution rate () and density of HIV awareness attempt (). Similarly, Fig. 4 depicts that is positively associated with TB transmission rate () and latent to active TB progression rate (). Its value can be lessened by controlling the probability of risky sexual practice () and time consumption parameter (). We also note that the value of diminishes with the increase of TB awareness distribution rate () and density of TB awareness attempt (). These basic reproduction numbers can also be scaled down by increasing the treatment rates (l, m) and efficacy of awareness (). Thus, prevention control by proper educational attempt with less time consumption and treatment control with less limitation of provision can impose a restriction in disease transmission by suppressing the epidemic potential.
Fig. 3.
Variations of awareness-induced basic reproduction number for HIV () with respect to (a) and , (b) and c1, (c) and l, and (d) and . Rest of the parameters are at the same values as in Table 1
Fig. 4.
Variations of awareness-induced basic reproduction number for TB () with respect to (a) and , (b) and , (c) and m, and (d) and . Rest of the parameters are at the same values as in Table 1
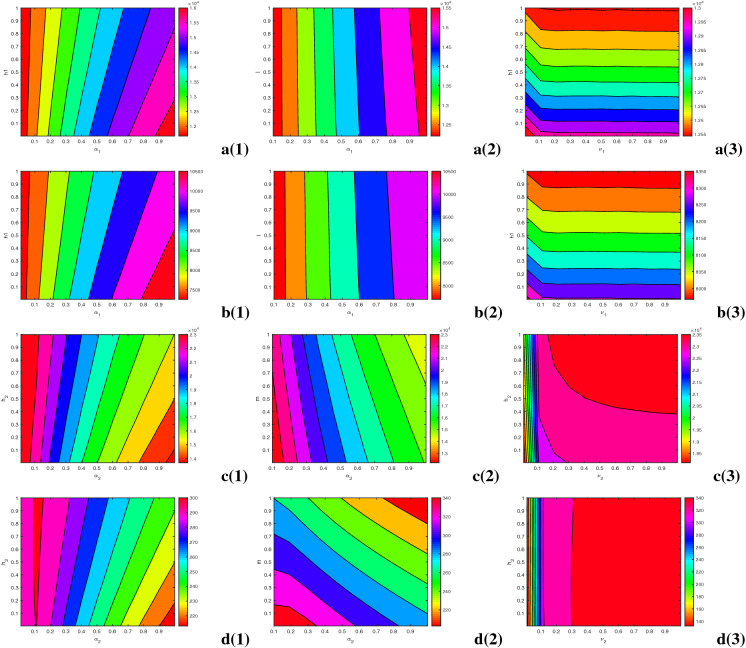
Next, to assess the influence of dominant parameters, we plot the singly infected individuals by differing two parameters simultaneously (see Fig. 5). In the figures, the contour lines signify the equilibrium values of singly infected populations. Figure 5a, b evince huge influence of time consumption parameter (), provision limitation () on HIV- and AIDS-infected population as HIV/AIDS-infected population increases with an increase in the values of and . HIV infected populations ( and ) are negatively associated with awareness dissemination rate () and treatment rate (l). Figure 5c, d shows the negative impacts of treatment rate (m) and TB awareness distribution rate () on latent TB-infected (L) and active TB-infected (I) individuals. It is apparent from the figure that on scaling up the time-consuming parameter () and resource-restricting parameter (), the number of TB-infected individuals increases massively. Overall, these figures depict the crucial roles of awareness and treatment in lowering the singly infected cases. It is necessary to augment the consumption of disease education by raising the awareness dissemination rates and minimizing the time consumption for educational attempts. Importantly, to curb the disease, medical support is the main weapon to restrict the co-infection and that should be accessible by reducing the limitation of resources as much as possible.
Fig. 5.
Contour plots of HIV-infected individuals (first row) with respect to a(1) and , a(2) and l, a(3) and ; AIDS-infected individuals (second row) with respect to b(1) and , b(2) and l, b(3) and ; latent TB-infected individuals (third row) with respect to c(1) and , c(2) and m, c(3) and ; and active TB-infected individuals (fourth row) with respect to d(1) and , d(2) and m, d(3) and . Other parameters are at the same values as in Table 1
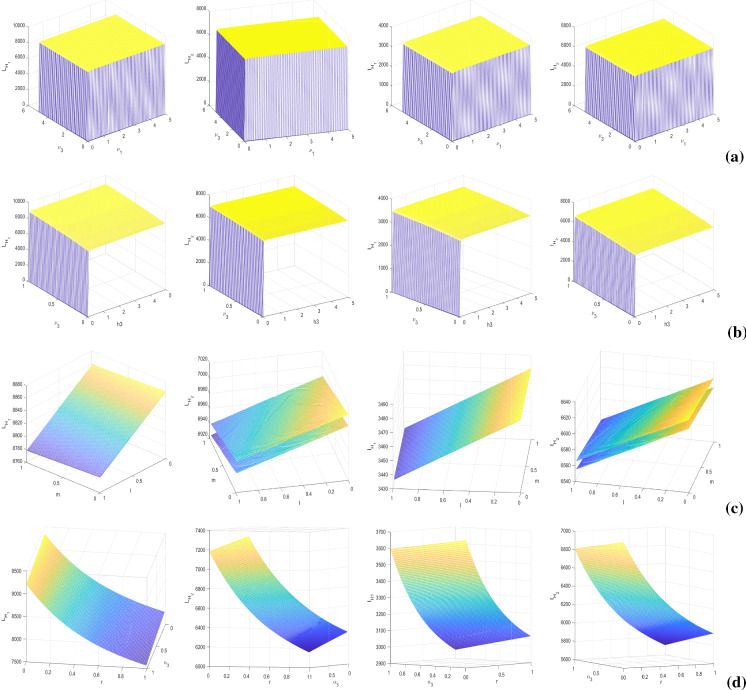
Now, we investigate the impacts of some ruling parameters specifically on dually infected populations, by plotting the model variables and with numerical variations of parameters in pairs viz. , , (l, m) and , Fig. 6. The sizes of co-infected populations are depicted by the surfaces at equilibrium, i.e., steady state or persevering oscillation. Presence of two surfaces in a figure indicates the highest and lowest numbers of co-infected individuals appearing in a limit cycle. In Fig. 6a, we assess the impact of provision limitation of HIV treatment as well as disruption in HIV-TB co-infection treatment on dual infection. It is clear from the figure that scaling up the resource limitation of HIV treatment induces disruption in co-infection treatment too, i.e., the value of raises together with the value of and minute limitation of HIV treatment produces a large number of co-infection, along with the increased restriction of co-infection treatment. The influence of time consumption in HIV-TB co-infection-related educational attempt and provision restriction of co-infection treatment are illustrated, reciprocally, in Fig. 6b. The figures show that when the parameter surpasses the value 0.05, the resource limitation induces certainly an increase in the co-infected individuals. Co-infection also increases with the increase in values of , which justifies the importance of awareness attempt in controlling dual-endemic, in a provision limitation condition. Figure 6c signifies that individual treatments of single infections impact the co-infection massively, by reducing the number of dually infected individuals. That is why, it is necessary to suppress the disruption in both HIV and TB medications. Figure 6d exhibits that co-infection diminishes rapidly with the growing treatment rate of co-infection (r) and HIV-TB awareness circulation rate ().
Fig. 6.
Surface plots of co-infected individuals (first column), (second column), (third column) and (fourth column) with respect to (a) and , (b) and , (c) l and m, and (d) and r. Other parameters are at the same values as in Table 1
Time series solutions and stability of equilibrium points
For parameter values in Table 1 and , we obtain the value of awareness-induced basic reproduction number for HIV model (2) as , which is less than unity. The HIV-free equilibrium is obtained as , whose local stability is illustrated in Fig. 7a. The figure clearly shows the existence of locally asymptotically stable equilibrium of system (2). Further, Fig. 7b justifies Theorem 2 by illustrating the global stability of HIV-free equilibrium in space, when there is no provision restriction for HIV treatment, i.e., . The solution trajectories plotted in Fig. 8a show the existence of a locally asymptotically stable HIV endemic equilibrium for , though . Figure 8b shows the existence of backward bifurcation by illustrating the co-existence of locally asymptotically stable endemic equilibrium and stable DFE in space. In Fig. 9a, we illustrate the existence of HIV endemic equilibrium for by choosing , and . The figure depicts local asymptotic stability of the equilibrium when as the solution trajectories starting from different initial conditions converge to . Importantly, we observe that for , the endemic equilibrium exists in an unstable mode whenever whereas this equilibrium becomes stable whenever . This demonstrates an exchange in the stability property of the equilibrium and the presence of forward bifurcation at (see Fig. 9b). Thus, Figs. 8 and 9a, b illustrate Theorem 3 numerically. Figure 9c indicates the stability of HIV endemic equilibrium for .
Fig. 7.
Figures illustrating a(1)-a(2) HIV-free equilibrium with for and (b) globally asymptotically stable DFE with . Other parameters are at the same values as in Table 1
Fig. 8.
(a) Solution trajectories of system (2) illustrating the existence of locally asymptotically stable HIV endemic equilibrium with , and (b) visualization of backward bifurcation in space. Other parameters are at the same values as in Table 1
Fig. 9.
(a) Solution trajectories of system (2) illustrating the existence of locally asymptotically stable HIV endemic equilibrium for , (b) three-dimensional illustration of and (c) global stability of another HIV endemic equilibrium in space with ( by taking , and .) Other parameters are at the same values as in Table 1
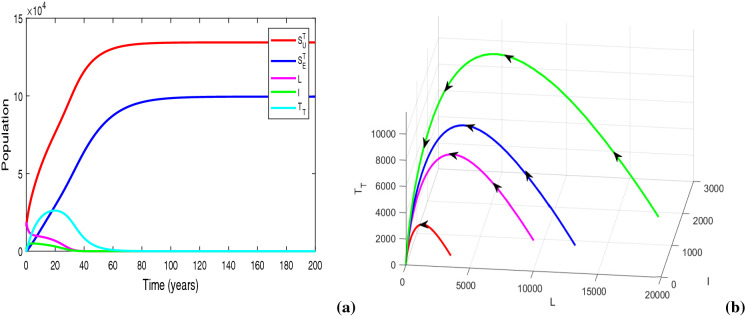
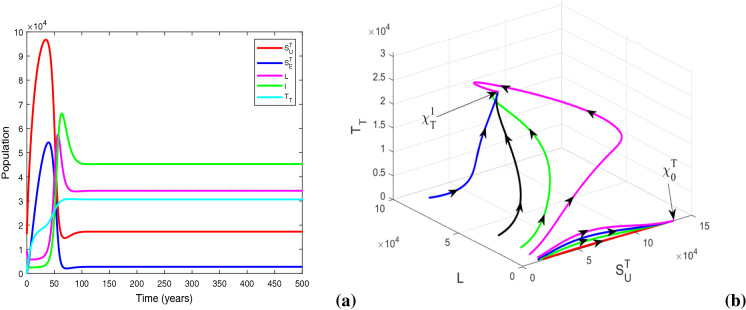
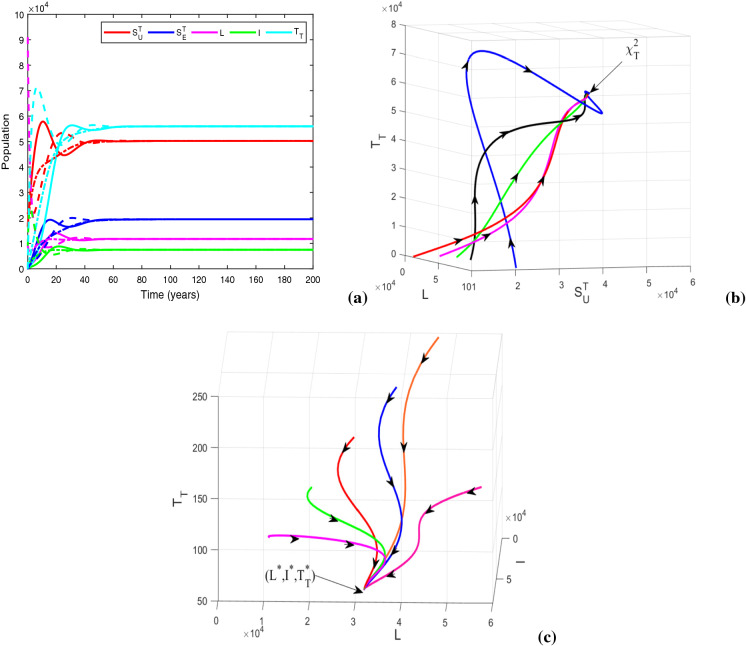
In Fig. 10a, we plot the populations of TB-only dynamics for . The figure exhibits TB-free equilibrium for sufficiently small value of resource limitation parameter, i.e., . In Fig. 10b, we justify Theorem 5 numerically, by illustrating the global stability of TB-free equilibrium when there is no provision limitation in TB treatment (i.e., ). Figure 11a depicts that for , system (10) settles at the locally asymptotically stable endemic equilibrium , in spite of having the basic reproduction number less than unity. Figure 11b shows the co-existence of locally asymptotically stable endemic equilibrium and stable DFE for when . For parameter values in Table 1 and , , , we obtain . Figure 12a exhibits the existence of locally asymptotically stable TB endemic equilibrium for . Figure 12a, b signifies the fact that the equilibrium switches its stability at when . Hence, Theorem 6 is illustrated numerically in Figs. 11 and 12a, b. Figure 12c reveals the stability of TB endemic equilibrium for
Fig. 10.
Figures illustrating (a) TB disease-free equilibrium with for , (b) globally asymptotically stable DFE with . Other parameters are at the same values as in Table 1
Fig. 11.
(a) Solution trajectories of system (10) illustrating the existence of locally asymptotically stable TB endemic equilibrium with , , (b) visualization of backward bifurcation in space. Other parameters are at the same values as in Table 1
Fig. 12.
(a) Solution trajectories of system (10) illustrating the existence of locally asymptotically stable TB endemic equilibrium for , (b) three-dimensional illustration of and (c) global stability of another TB endemic equilibrium in space for ( by taking , and ). Other parameters are at the same values as in Table 1
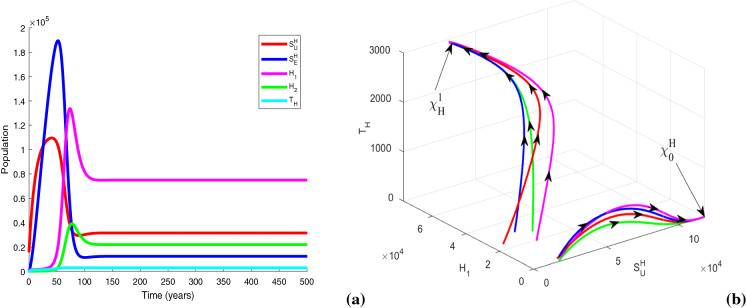
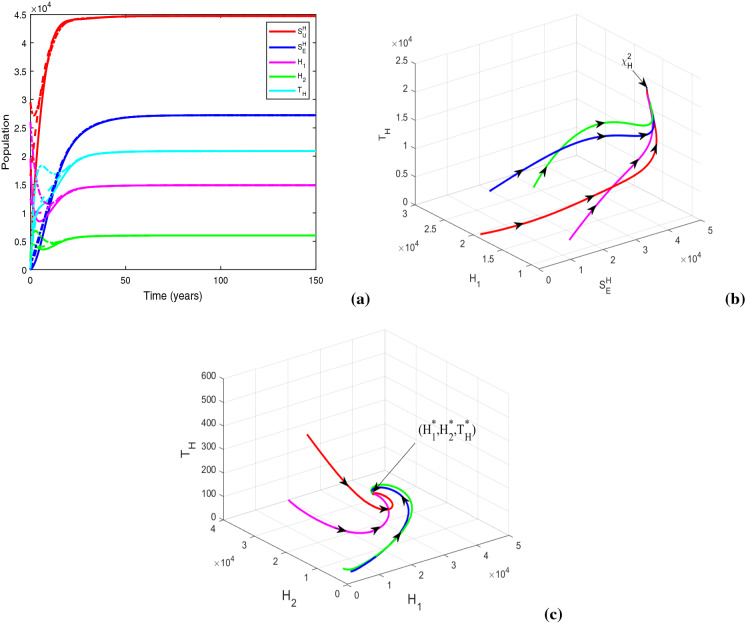
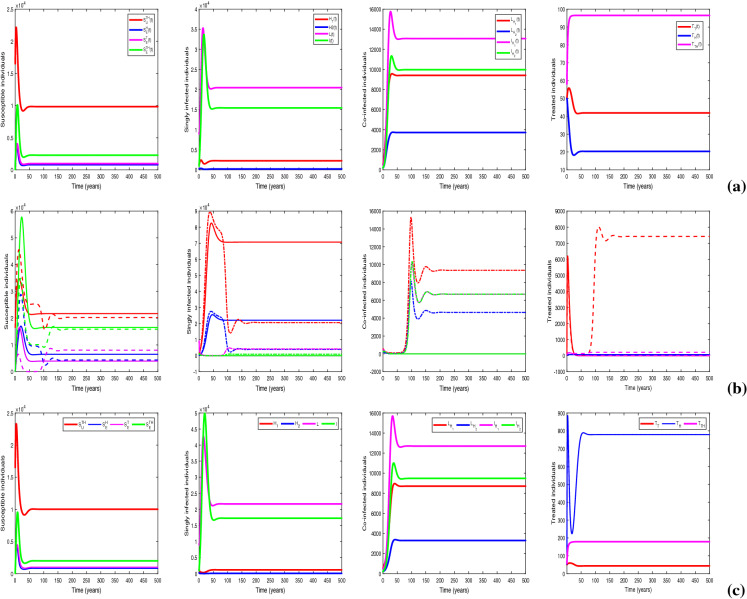
We plot the solution trajectories of the HIV-TB system (1) for different provision limitation conditions in Fig. 13. For the baseline parameter values in Table 1, we obtain and . Thus, . In Fig. 13(a), we can observe an stable HIV-TB endemic equilibrium along with the disease-free equilibrium under resource restriction condition, though the basic reproduction number is less than unity. In Fig. 13b, the solution trajectories of system (1) have been plotted in the absence of resource limitation for TB treatment (). In the figure, solid lines represent subpopulations in the presence of awareness attempt and the dashed lines indicate the individuals in the absence of TB awareness (i.e., ). It is apparent from the figure that the co-infection persists in the population when there is no educational attempt for TB, in spite of having no provision limitation of TB treatment. Though in this case, TB and co-infection are suppressed significantly up to a certain period of time, after that TB infection starts to increase with a rapid growth of co-infection and leads to an HIV-TB endemic equilibrium Moreover, on introducing TB awareness, TB infection and co-infection can be completely eradicated from the population, and there exists an HIV endemic equilibrium This emphasizes the importance of awareness in resource limitation condition. In Fig. 13c, we plot the dynamics of system (1) for the situation when the HIV treatment provision limitation is zero (). In this case, system (1) approaches to the HIV-TB endemic equilibrium . Thus, we find that the HIV-TB co-infection persists in the population for inadequate treatment resources of both the diseases, in spite of having basic reproduction number below unity for HIV as well as TB submodels. Hence, these results reveal that it is not enough to scale down the basic reproduction number only, to curtail the co-infection. It is necessary to reduce the limitation for co-infection treatment by controlling HIV and TB both treatment restrictions to suppress the dual epidemic burden. However, the co-infection can be removed from the population by eliminating TB treatment provision limitation only when awareness attempt is applied, but in that case HIV infection persists. These phenomena can suggest a useful control strategy to curb the dual epidemic under provision restriction condition.
Fig. 13.
Variations of susceptible, singly infected, co-infected and treated individuals with respect to time (a) under treatment provision limitation of HIV, TB and co-infection (i.e., , , ), (b) under treatment provision limitation of HIV and co-infection (i.e., , , ) (The dashed lines represent the case of absence of TB awareness attempt, i.e., ), and (c) under treatment provision limitation of TB and co-infection (i.e., , , ). Other baseline parameter values are same as in Table 1
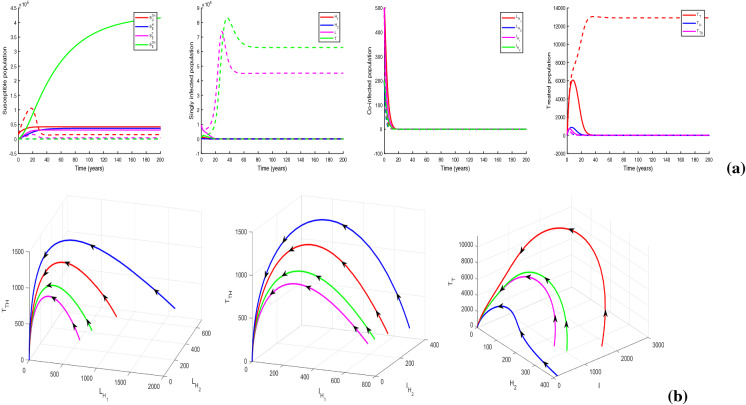
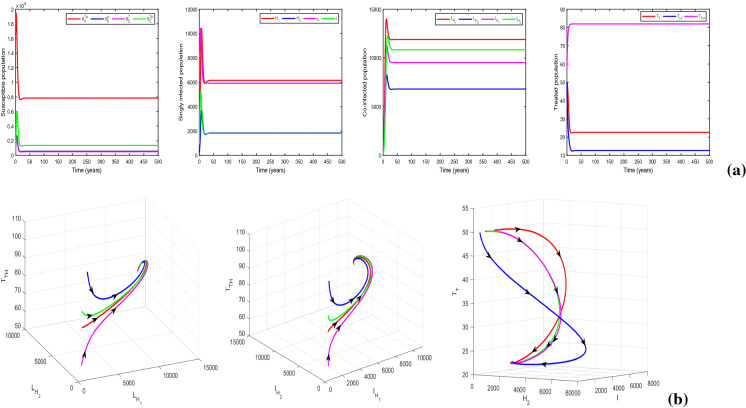
Now, we take , and , and keep rest of the parameters at the same values as in Table 1. For this parametric setup, we get . The solution trajectories plotted in Fig. 14a shows the existence of a DFE and TB endemic equilibrium in the absence of any educational attempt. In the figure, the equilibria and are indicated by the solid and dashed lines, respectively. Figure 14b justifies the global stability of HIV-TB disease-free equilibrium numerically, when there is no restriction on treatment resources. Recall that the global stability of could not be assured analytically. It can be inferred from the figure that the co-infection can be curbed by restraining the provision limitation. In Fig. 15, the cohorts have been plotted by choosing , , , and for which . The figure generates the HIV-TB endemic equilibrium . Further, Fig. 15b illustrates the global stability of HIV-TB endemic equilibrium .
Fig. 14.
Figures illustrating (a) HIV-TB disease-free equilibrium (solid lines) and TB endemic equilibrium in the absence of educational attempt (dashed lines) with , , and (b) global stability of HIV-TB disease-free equilibrium when . Other baseline parameter values are same as in Table 1
Fig. 15.
Figures illustrating (a) HIV-TB endemic equilibrium for , and (b) three-dimensional illustration of endemic equilibrium . Other baseline parameter values are same as in Table 1
Solution of optimization problem (21)
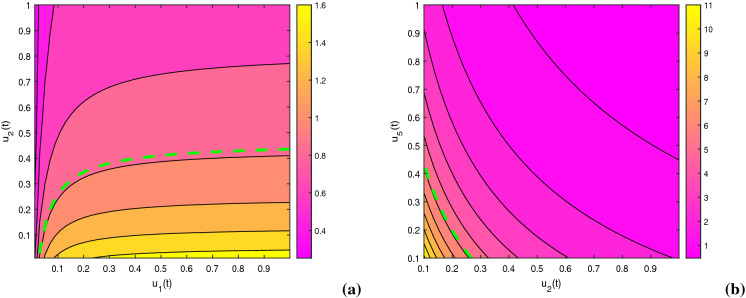
We implement fourth-order Runge–Kutta method to solve the proposed optimization problem (21) for a fixed time span of 10 years, by considering the aforementioned initial conditions of the state variables. The optimization policy is taken into account for a specific period of time due to involvement of cost and limited provision in managing this dual-epidemic. The constants of the objective function are taken as , , , , , , , , , , , , and . We initiate the process by guessing the controls satisfying the constraints. After that, the state equation system is solved beginning with the initial conditions onward and co-state system is solved reversely. Figure 16 exhibits the influence of awareness control together with treatment control on the basic reproduction numbers and . In the figure, contour plots convey that the basic reproduction number can be diminished by applying these optimal techniques, that inspires us to construct such optimization problem.
Fig. 16.
Impact of optimal control measures on basic reproduction numbers (a) (, , , , , , ) and (b) . Other baseline parameter values are same as in Table 1
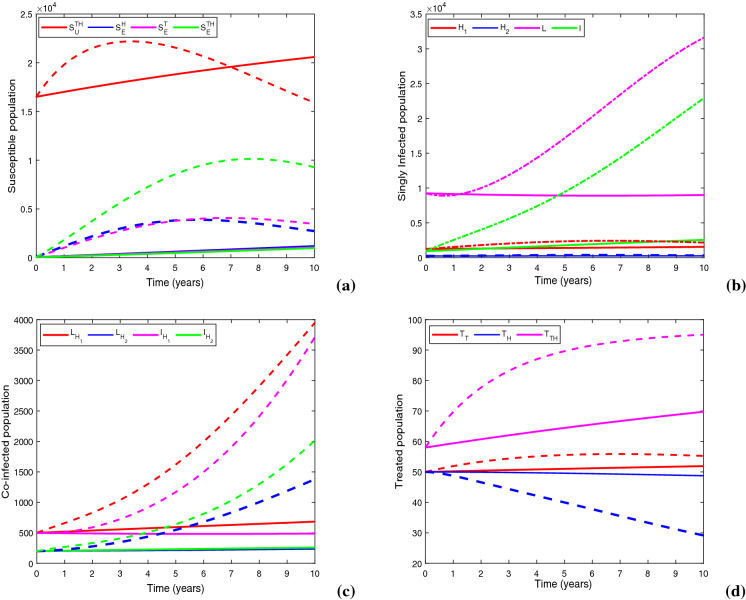
Figure 17 demonstrates a comparison between baseline control case and optimal control case by illustrating the state trajectories. At the termination point of scheduled time span, there is a reduction in class by 28.86%, in L class by 71.4%, in I class by 88.84%, in class by 82.7%, in class by 82.95%, in class by 86.86% and in class by 87.23%, in comparison with the case of baseline control technique. Thus, the proposed optimization mechanism has an enormous impact on both single and dual infections, that demolishes the epidemic curve under limited treatment provision condition induced by COVID-19 pandemic situation.
Fig. 17.
Figures show the impacts of baseline control (dashed lines) and optimal control (solid lines) on (a) susceptible population, (b) singly infected population, (c) co-infected population and (d) treated population. Parameter values are same as in Table 1
Figure 18 demonstrates this optimization approach, in which all the educational attempts and treatment controls are applied together for a planned time span of 10 years. As there is still no vaccination or curable medication for HIV and the HIV treatment structure is facing provision limitation, it is optimal to continue HIV awareness effort intensively for about 9.5 years from the starting. Initially, TB educational attempt should be applied in low intensity for almost 2.38 years, after that when TB infection becomes perceptible, it is necessary to execute TB awareness attempt with full intensity until 9.72 years. Co-infection awareness consumption is to be continued with a lower density throughout the planned time interval. The optimal strategy recommend to maintain 100% initial treatment rates for both HIV and TB individual infections until the end of planned time interval. However, the initial treatment effort for co-infected people should be continued for about 4 years. After that, it is ideal to reduce the initial treatment rate of co-infection till 8.83 years and uphold that decreased intensity up to the end of planned period.
Fig. 18.
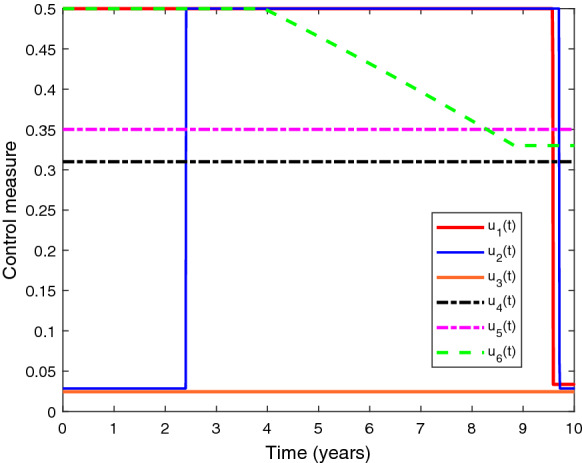
Depiction of optimal control measures with respect to time. Parameter values are same as in Table 1
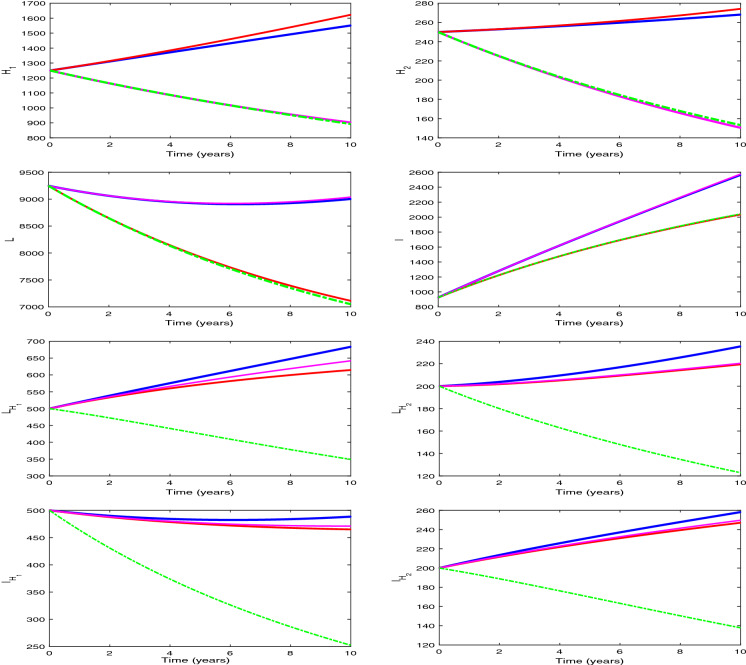
Figure 19 depicts the variations in optimal control impact while curbing the dual-epidemic for different provision limitation conditions. In the figure, we have plotted the infected populations under optimization strategy for four cases viz. provision limitations for HIV, TB and co-infection (, , ); provision limitation for TB and co-infection (, , ); provision limitation for HIV and co-infection (, , ); and no provision limitation (). We observe from the figure that the impact of optimal control is higher when there is no provision limitation for HIV and also in case of no resource limitation of TB treatment. Thus, it is deduced that as the resource restriction decreases, the impact of optimal control increases in restraining the outbreak. It can be inferred that optimal control has an immense effect in suppressing the dual pandemic burden if there is no provision restriction of HIV medication and has the greatest influence when there is no resource limitation for any treatment management.
Fig. 19.
Impacts of optimal control on infected individuals for , , (blue line); , , (magenta line); , , (red line); and (green dash-dot line). Values of other parameters are the same as in Table 1
Discussion
In this paper, an HIV-TB dual epidemic model that embraces provision limitation of treatments for both the diseases attributed to COVID-19 pandemic is investigated. In the proposed model, we have incorporated awareness attempts for both single as well as dual infections. The treatment rates are taken as Holling type-II functional pattern as the resources are limited for HIV, TB and co-infection medications. Also, we have taken into account four disjoint cohorts of susceptible individuals regarding the educational attempts of HIV, TB and co-infection, which makes our system more extensive. The model analysis reveals that awareness attempt significantly regulates the epidemic threshold. We found that for the model with either HIV or TB, the DFE is locally asymptotically stable whenever the awareness-induced basic reproduction number is below unity; further, it is globally asymptotically stable only when there is no provision limitation for treatment. We have also evaluated thresholds and for provision limitation parameters of the models with HIV and TB only, which are found to regulate the dynamical behavior of co-infection system. This assures the existence of locally asymptotically stable endemic equilibrium of each single infection model whenever the basic reproduction number is above unity provided the provision limitation remains under the obtained threshold value. Moreover, the system undergoes a transcritical bifurcation while crossing the unit epidemic edge. If the basic reproduction number is below unity, the HIV and TB submodels are found to exhibit backward bifurcations provided the provision limitation parameters exceed their respective threshold values. For HIV-TB co-infection model, the DFE is locally asymptotically stable whenever , but its global stability cannot be assured analytically. Overall, our analytical findings suggest to control the provision limitations for both the diseases to dominate the current situation.
Our numerical result explored the influences of dominant parameters on awareness-induced basic reproduction numbers. It recommends that epidemic aspect can be diminished by increasing the treatment rate along with consumption rate of awareness by scaling up the density of educational attempt, rate of propagating awareness and decreasing the consumption of time while making people aware. Assessment of the significant parameters’ impact on infected individuals conveys the prominence of provision limitation that necessitates an urgent increase of treatment by curbing resource restriction to control the single as well as dual infections. We found that the endemic equilibrium exists under provision limitation situation for each single disease model, though the basic reproduction number remains below unity. Limited treatment provisions for HIV, TB and co-infection exhibit the persistence of co-infection even though . Therefore, it is not sufficient to scale down the basic reproduction number to curtail the dual epidemic; treatment accessibility should be increased by reducing the provision limitation. In case of basic reproduction number less than unity, in spite of eliminating the provision limitation of TB medication, co-infection relapses after a significant reduction and persists in the population for a long time, if TB awareness is not propagated. But, it evinces HIV infection only under awareness control. Meanwhile, consideration of accessibility of HIV treatment cannot eliminate the infection from the population. Therefore, co-infection can be curtailed by abolishing the provision limitation of TB treatment only if the awareness control is implemented. Moreover, when the provision restrictions are sufficiently small, TB infection remains in the population in the absence of any educational attempt in spite of having basic reproduction number less than unity. Although, analytical findings could not assure the global stability of DFE of the co-infection model, we have illustrated it numerically when there is no limitation of treatment provisions. We have also shown the global stability of endemic equilibrium of co-infection model numerically for .
Finally, an optimization problem is constructed and solved that manifest epidemiological achievement by demolishing epidemic curve through optimization policy assimilating educational attempt along with treatment control of both single and dual infections, under limited medical provision. In the present provision limitation condition induced by COVID-19 pandemic, it is optimal to apply both awareness and treatment controls to curb the dual epidemic by following the strategy proposed in this study. Different impacts of our optimal policy for four individual resource restriction cases have been observed, exploring the vast influence of optimal control when resource of HIV treatment is not limited and also when TB service resource is not limited. It prescribes “no provision limitation” as the most impactful case while suppressing the co-infection load.
To the best of our knowledge, the model proposed in the present study is the first mathematical modeling approach to assess the current resource limitation condition of HIV and TB services induced by COVID-19 pandemic. Previously, a little bit attention has been paid on the impact of resource limitation on HIV-TB dual epidemic [28, 35, 38, 39]. But, none of the previous study could consider the impact of COVID-19 situation. Sharomi et al. [38] investigated a model for HIV-TB co-infection by including four types of treatment strategies, suggesting that the HIV-only treatment policy is comparatively more effective than that of TB-only. They concluded that only one disease should be treated in case of resource limitation and universal strategy is the most beneficial for co-infection control. Akwafuo et al. [39] studied the burden of HIV-TB co-infection in a low intervention area, West Africa, by presenting geographic analysis together with hybrid mathematical modeling to find the optimal control strategy. Their findings suggested that treatment of active TB-infected people before starting HIV treatment can reduce TB infection, and in resource limitation environment, testing and medication of TB disease should be accelerated for HIV negatives to prevent co-infection. Tanvi and Aggarwal [28] proposed an HIV-TB model introducing a constant time delay associated with retarded diagnosis and execution of treatment. They concluded that detection and treatment for both diseases within a proper time can result in economic and epidemic benefits. Authors did not consider saturated treatment rate in [28, 38, 39]. Later on, Tanvi et al. [35] introduced Holling type-II function in HIV-TB co-infection model as a resource-limited treatment rate of TB. But, they have not considered the matter of provision limitation in case of HIV treatment, and that is why, a constant treatment rate has been taken for HIV. Also, in [35], authors have not incorporated the awareness control. On the other hand, in the present investigation, we have incorporated Holling type-II treatment rates for both HIV and TB diseases by considering the provision limitation induced by COVID-19, and assessed the impact of awareness attempt under such condition. Our model assumptions exhibit more epidemiologically realistic and captivating dynamical behavior than the traditional epidemiological models and may contribute a lot to investigate the impact of recent provision restriction condition on HIV-TB dual epidemic. Moreover, the aforementioned studies could not provide any optimal policy for controlling the resource limitation situation. But, in the present study, we have introduced an optimization technique that gives a suitable strategy to control the dual epidemic by using awareness and treatment controls under the resource limitation condition. In [35], authors concluded that curbing TB infection can play a major role in controlling the co-infection under resource limitation condition for TB treatment. However, our findings provide specific thresholds of provision limitation that can help to diminish the restriction of HIV-TB medication. Further, our results suggest that increasing the accessibility of TB treatment by suppressing the limitation for TB service only is not enough to curb the dual epidemic under provision-restricted situation in absence of awareness. Our numerical findings convey that the co-infection can persist in the population forever though the epidemic threshold is below unity if the current provision limitation situation continues in an unmanageable manner. Thus, awareness attempt should be introduced and provision limitation must be controlled for co-infection service to dominate the dual epidemic burden.
Conclusion
In this study, we have made an attempt for the first time to construct a mathematical model in order to investigate the present provision restriction condition of HIV and TB services induced by COVID-19 pandemic. Our findings suggest that, as the recent medical disruption caused by COVID-19 pandemic puts an enormous burden on the dual epidemic, the limitation of treatment provisions should be controlled as much as possible for HIV, TB and co-infection. Moreover, the crucial role of educational attempts is apparent from our investigation, in controlling the outbreak under provision restriction situation that include preventive mechanism, self-shielding measures, TB vaccination, motivation to acquire medication, etc. Most importantly, the derived thresholds for the treatment provision limitations of HIV and TB services can give a transparent idea about the extent to which the resource restriction should be diminished to curb the dual epidemic. Further, the optimization technique proposed in our study can be beneficial to construct practicable strategy to curtail HIV-TB dual epidemic with awareness and treatment control. This optimal policy will lead to epidemic as well as economic gain in this critical situation. The numerical results of the present investigation suggest that co-infection can be curtailed by suppressing provision restriction of TB treatment at the presence of awareness attempt and reducing the resource limitation for the treatment of co-infection is the best way to control the dual epidemic under resource restricted condition. Our results convey that the existing HIV-TB control programs need to be modified with recent situation-related awareness which will accelerate the patients’ response to the healthcare system. According to the urgency of situation, people’s behavior toward this dual epidemic must be modified as the responsible citizens. Necessary steps must be taken in order to make people aware about the consequence of COVID-19 impacting HIV-TB services. This should not be neglected while fighting against COVID-19 pandemic, keeping the long-term effect in mind. The present mathematical approach may become the first step to catch the eyes on this matter.
The dynamics of COVID-19 has been assessed by numerous mathematical models since the starting of the pandemic [40, 41]. In the present study, we did not incorporate the explicit dynamics of COVID-19 in the mathematical model formulation to investigate its direct influence on HIV-TB dual epidemic. Although our model explored an overall impact of resource limitation on HIV-TB dual epidemic due to COVID-19 pandemic situation, but to further extrapolate the results of this study, advance extension of our model system might be worth investigating. The present study can be extended by assimilating the dynamics of COVID-19. It would be interesting to examine the models with HIV and COVID-19, TB and COVID-19, and HIV, TB and COVID-19 co-infections individually.
Acknowledgements
The authors express their gratitude to the learned reviewers whose comments and suggestions have helped to improve this paper.
Appendix A
To investigate the global stability of disease-free equilibrium , we consider the following as a Lyapunov function candidate:
where and The Lyapunov derivative of is obtained as,
Clearly, for only when the supply of treatment provisions has no limitation (). As all the parameters of HIV model (2) are non-negative and if and only if , so is a Lyapunov function in and is the largest compact invariant set in . Consequently, by LaSalle’s Invariance Principle [31], when , all the solutions of system (2) with initial conditions in proceed toward the HIV-free equilibrium as for . Therefore, if there is no limitation of treatment provisions, HIV infection will be eliminated from the population.
Appendix B
We apply the center manifold theory [32] to investigate the stability of endemic equilibrium point as standard linearization of system (2) around this equilibrium is strenuous and not persuadable mathematically. To use Theorem 4.1 of [32], we reconstruct the HIV model (2) in the form , by taking , , , , , and by introducing as follows:
| 25 |
For , we get a critical value of (say ) as
| 26 |
Evaluating the Jacobian matrix of system (25) at DFE , we get the following matrix
As , the linearization matrix has a simple zero eigenvalue. Hence, the center manifold theory can be used to analyze the local asymptotic stability of the endemic equilibrium point .
There must exist a right eigenvector and a left eigenvector of Jacobian matrix , associated with zero eigenvalue whose components at are obtained as
Now, we compute the following second-order non-vanishing partial derivatives of f at the disease-free equilibrium point to calculate a and b, following Theorem 4.1 of [32] (as , so there is no need to calculate the partial derivatives of and ), and get
By substituting the above values in the expressions for a and b, we have
It is clear that b is always positive. Note that if , and if the inequality is reversed. Therefore, by Theorem 4.1 of [32], it can be concluded that the endemic equilibrium point of HIV-only model (2) is locally asymptotically stable for with near 1 (i.e., ) and . Here, is obtained as
If , system (2) evinces a backward bifurcation (i.e., stable endemic equilibrium coexists with stable disease-free equilibrium) for . On the other hand, if (i.e., ) there exists a supercritical transcritical bifurcation at . That is, the behavior of endemic equilibrium changes from unstable (for ) to stable (for ) while passing through , associated with bifurcation parameter . Thus, the proof is completed.
Funding
The research work of Madhuri Majumder is supported by the Scheme “Innovation in Science Pursuit for Inspire Research,” Department of Science & Technology, Ministry of Science & Technology, Government of India, New Delhi in the form of Senior Research Fellowship (No: DST/INSRIRE Fellowship/[IF180693]). The research work of Samares Pal is partially supported by the DST-PURSE-II programme of University of Kalyani.
Data availability statements
All data generated or analyzed during this study are included in this article.
Declarations
Conflict of interest
The authors declare that there is no conflict of interests regarding the publication of this article.
Ethical standard
The authors state that this research complies with ethical standards. This research does not involve either human participants or animals.
Footnotes
Publisher's Note
Springer Nature remains neutral with regard to jurisdictional claims in published maps and institutional affiliations.
Contributor Information
Madhuri Majumder, Email: majumdermadhuri01@gmail.com.
Pankaj Kumar Tiwari, Email: pktiwari.math@iiitbh.ac.in.
Samares Pal, Email: samaresp@yahoo.co.in.
References
- 1.Global HIV & AIDS statistics–Fact sheet, Preliminary UNAIDS 2021. Available at https://www.unaids/en/resources/fact--sheet.org. Accessed on 1–6–2021
- 2.Basic TB facts. Available at https://www.cdc.gov/tb/topic/basics/default.htm. Accessed on 5–6–2021
- 3.TB/HIV key facts and figures–WHO–World Health Organization. Available at https://www.who.int. Accessed on 22–6–2021
- 4.Global tuberculosis report 2020, Geneva: World Health Organisation, 2020. Licence: CC BY-NC-SA 3.0 IGO. Available at https://www.who.int. Accesed on 29–6–2021
- 5.Suthar AB, Lawn SD, Amo J, et al. Antiretroviral therapy for prevention of tuberculosis in adults with HIV: a systematic review and meta-analysis. PLoS Med. 2012;9:e1001270. doi: 10.1371/journal.pmed.1001270. [DOI] [PMC free article] [PubMed] [Google Scholar]
- 6.Abdool Karim SS, Naidoo K, Grobler A. Timing of initiation of antiretroviral drugs during tuberculosis therapy. N. Engl. J. Med. 2010;362(8):697–706. doi: 10.1056/NEJMoa0905848. [DOI] [PMC free article] [PubMed] [Google Scholar]
- 7.Mollel EW, Todd J, Msuya SE. Effect of tuberculosis infection on mortality of HIV-infected patients in Northern Tanzania. Trop. Med. Health. 2020;48:26. doi: 10.1186/s41182-020-00212-z. [DOI] [PMC free article] [PubMed] [Google Scholar]
- 8.WHO global lists of high burden countries for TB, multidrug/rifampicin-resistant TB (MDR/RR-TB) and TB/HIV, 2021-2025. Geneva: World Health Organization, 2021. Licence: CC BY–NC–SA 3.0 IGO. Available at https://www.who.int/tb/publications/global_report/high_tb_burdencountrylists2016-2020.pdf. Accessed on 1–7–2021
- 9.Roeger LW, Feng Z, Castillo-Chavez C. Modelling TB and HIV co-infection. Math. Biosci. Eng. 2009;6:815–837. doi: 10.3934/mbe.2009.6.815. [DOI] [PubMed] [Google Scholar]
- 10.Pinto CMA, Carvalho ARM. New findings on the dynamics of HIV and TB coinfection models. Appl. Math. Comput. 2014;242:36–46. [Google Scholar]
- 11.Ghosh I, Tiwari PK, Samanta S, et al. A simple SI-type model for HIV/AIDS with media and self-imposed psychological fear. Math. Biosci. 2018;306:160–169. doi: 10.1016/j.mbs.2018.09.014. [DOI] [PubMed] [Google Scholar]
- 12.Tanvi A, Aggarwal R, Raj YA. A fractional order HIV-TB co-infection model in the presence of exogenous reinfection and recurrent TB. Nonlinear Dyn. 2021;104:4701–4725. doi: 10.1007/s11071-021-06518-9. [DOI] [PMC free article] [PubMed] [Google Scholar]
- 13.Gakkhar S, Chavda N. A dynamical model for HIV-TB co-infection. Appl. Math. Comput. 2012;218(18):9261–9270. [Google Scholar]
- 14.Agusto FB, Adekunle AI. Optimal control of a two-strain tuberculosis-HIV/AIDS co-infection model. BioSystems. 2014;119:20–44. doi: 10.1016/j.biosystems.2014.03.006. [DOI] [PubMed] [Google Scholar]
- 15.Mallela A, Lenhart S, Vaidya NK. HIV-TB co-infection treatment: modeling and optimal control theory perspectives. J. Comput. Appl. Math. 2016;307:143–161. doi: 10.1016/j.cam.2016.02.051. [DOI] [Google Scholar]
- 16.Awoke TD, Kassa SM. Optimal control strategy for TB-HIV/AIDS co-infection model in the presence of behaviour modification. Processes. 2018;6(5):48. doi: 10.3390/pr6050048. [DOI] [Google Scholar]
- 17.Zhonghua Z, Yaohong S. Qualitative analysis of a SIR epidemic model with saturated treatment rate. J. Appl. Math. Comput. 2010;34:177–194. doi: 10.1007/s12190-009-0315-9. [DOI] [Google Scholar]
- 18.Dubey B, Patra A, Srivastava PK, Dubey US. Modeling and analysis of an SEIR model with different types of nonlinear treatment rates. J. Biol. Syst. 2013;21(3):1350023. doi: 10.1142/S021833901350023X. [DOI] [Google Scholar]
- 19.Dubey B, Dubey P, Dubey US. Dynamics of an SIR model with nonlinear incidence and treatment rate. Appl. Appl. Math. 2015;10(2):718–737. [Google Scholar]
- 20.Lü X, Chen SJ. New general interaction solutions to the KPI equation via an optional decoupling condition approach. Commun. Nonlinear Sci. Numer. Simul. 2021;103:105939. doi: 10.1016/j.cnsns.2021.105939. [DOI] [Google Scholar]
- 21.Chen SJ, Lü X, Li MG, Wang F. Derivation and simulation of the M-lump solutions to two (2+1)-dimensional nonlinear equations. Phys. Scr. 2021;96:095201. doi: 10.1088/1402-4896/abf307. [DOI] [Google Scholar]
- 22.Yin MZ, Chen SJ, Lü X. Localized characteristics of lump and interaction solutions to two extended Jimbo-Miwa equations. Chin. Phys. B. 2020;29:120502. doi: 10.1088/1674-1056/aba9c4. [DOI] [Google Scholar]
- 23.Tuberculosis and COVID-19-WHO–World Health Organization. Available at https://www.who.int. Accessed on 10–7–2021
- 24.WHO:access to HIV medicines severely impacted by COVID-19 as AIDS response stalls. Available at https://www.who.int. Accessed on 12–8–2021
- 25.The global HIV/AIDS epidemic. Available at https://www.kff.org/global-health-policy/fact-sheet/the-global-hivaids-epidemic. Accessed on 2–8–2021
- 26.HIV and tuberculosis co-infection programmes. Available at https://www.avert.org/professionals/hiv-programming/hiv-tb-coinfection. Accessed on 12–8–2021
- 27.Kassa SM, Ouhinou A. Epidemiological models with prevalence dependent endogenous self-protection measure. Math. Biosci. 2011;229:41–49. doi: 10.1016/j.mbs.2010.10.007. [DOI] [PubMed] [Google Scholar]
- 28.Tanvi, Aggarwal, R.: Stability analysis of a delayed HIV-TB co-infection model in resource limitation settings. Chaos Solit. Fract. 2020;140:110138. doi: 10.1016/j.chaos.2020.110138. [DOI] [Google Scholar]
- 29.Lakshmikantham, V., Leela, S., Martynyuk, A.A.: Stability analysis of nonlinear systems. New York: Marcel Dekker, Inc. p. 155–170 (1989)
- 30.van den Driessche P, Watmough J. Reproduction numbers and sub-threshold endemic equilibrium for compartmental models of disease transmission. Math. Biosci. 2002;180(1–2):29–48. doi: 10.1016/S0025-5564(02)00108-6. [DOI] [PubMed] [Google Scholar]
- 31.LaSalle, J. P.: The stability of dynamical systems, Regional conference series in applied mathematics. SIAM, Philedelphia. (1976)
- 32.Castillo-Chavez C, Song B. Dynamical models of tuberculosis and their applications. Math. Biosci. Eng. 2004;1(2):361–404. doi: 10.3934/mbe.2004.1.361. [DOI] [PubMed] [Google Scholar]
- 33.Castillo-Chavez, C., Feng, Z., Huang, W.: On the computation of and its role on global stability. Mathematical approaches for emerging and reemerging infectious diseases: an introduction (Minneapolis, MN, 1999). IMA Vol. Math. Appl., 125, 229–250 (2002)
- 34.Onori, S., Serrao, L., Rizzoni, G.: Pontryagin’s minimum principal, hybrid electric vehicles, SpingerBriefs in control. Autom. Robot. 51–63 (2016)
- 35.Tanvi, Aggarwal, R., Kovacs, T.: Accessing the effect of Holling type-II treatment rate on HIV-TB co-infection. Acta Biotheor. 69, 1–35 (2021) [DOI] [PubMed]
- 36.Blower, S.M., Dowlatabadi, H.: Sensitivity and uncertainty analysis of complex models of disease transmission: an HIV model, as an example. Int. Stat. Rev. 62, 229–243 (1994)
- 37.Marino S, Hogue IB, Ray CJ, Kirschner DE. A methodology for performing global uncertainty and sensitivity analysis in systems biology. J. Theor. Biol. 2008;254(1):178–196. doi: 10.1016/j.jtbi.2008.04.011. [DOI] [PMC free article] [PubMed] [Google Scholar]
- 38.Sharomi O, Podder CN, Gumel AB, Song B. Mathematical analysis of the transmission dynamics of HIV/TB coinfection in the presence of treatment. Math. Biosci. Eng. 2008;5:145–174. doi: 10.3934/mbe.2008.5.145. [DOI] [PubMed] [Google Scholar]
- 39.Akwafuo SE, Abah T, Opong JR. Evaluation of the burden and intervention strategies of TB-HIV co-infection in West Africa. J. Infect. Dis. Epidemiol. 2020;6(4):143. [Google Scholar]
- 40.Lü X, Hui Hw, Liu FF, et al. Stability and optimal control strategies for a novel epidemic model of COVID-19. Nonlinear Dyn. 2021;106:1491–1507. doi: 10.1007/s11071-021-06524-x. [DOI] [PMC free article] [PubMed] [Google Scholar]
- 41.Yin MZ, Zhu QW, Lü X. Parameter estimation of the incubation period of COVID-19 based on the doubly interval-censored data model. Nonlinear Dyn. 2021;106:1347–1358. doi: 10.1007/s11071-021-06587-w. [DOI] [PMC free article] [PubMed] [Google Scholar]
Associated Data
This section collects any data citations, data availability statements, or supplementary materials included in this article.
Data Availability Statement
All data generated or analyzed during this study are included in this article.


