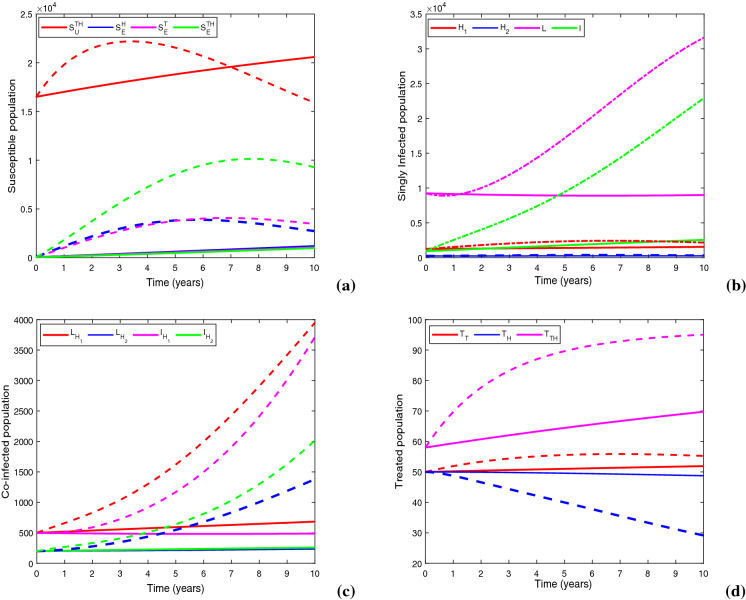
Fig. 17.
Figures show the impacts of baseline control (dashed lines) and optimal control (solid lines) on (a) susceptible population, (b) singly infected population, (c) co-infected population and (d) treated population. Parameter values are same as in Table 1

