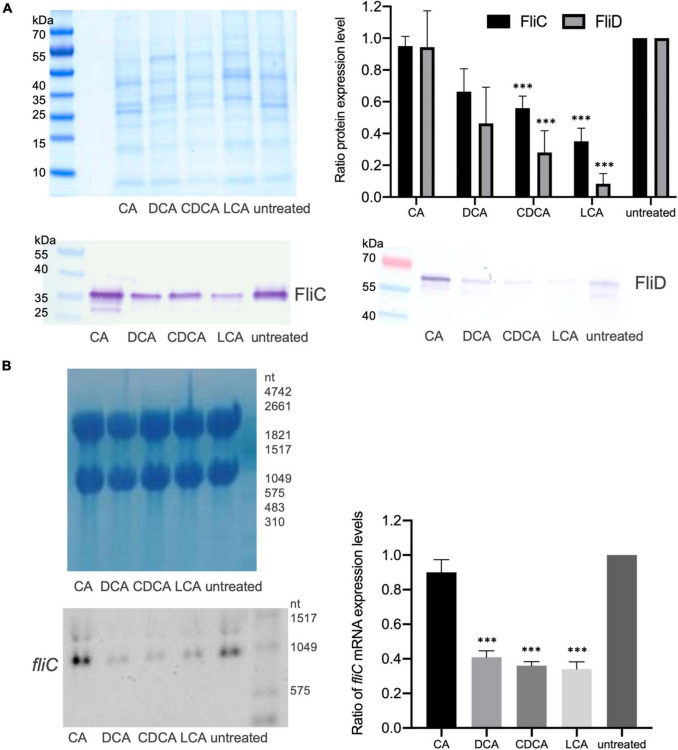
FIGURE 2.
Flagella protein expression. (A) Western Blot analysis of FliC and FliD expression in untreated cells and in cells stressed with the four different BAs with a Coomassie-stained gel in the upper left corner that was run as a loading control in parallel. Right (top): Average quantification of signal intensities of FliC as well as FliD bands of three replicates normalized to untreated condition. (B) Transcriptional profiling of fliC expression by Northern Blotting. Left (top): Methylene blue staining of RNA gel serving as a loading control. Left (bottom): Exemplary fliC-specific Northern Blot. Right: Three biological replicates were analyzed and normalized to the control condition. Standard deviation is indicated and values significantly different by a Student’s t-test compared to untreated cells are marked (***p-value <0.001).

