FIGURE 3.
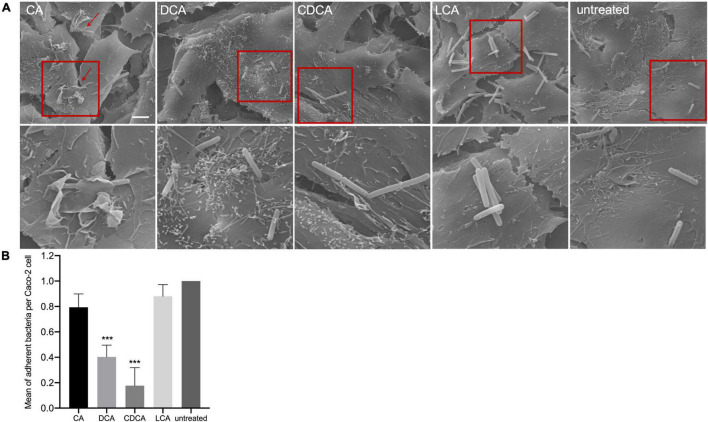
Co-cultivation of bile acid stressed C. difficile with Caco-2 cells. (A) Scanning electron micrographs of co-cultivation of Caco-2 cells with untreated C. difficile and C. difficile challenged with four different bile acids (CA, cholic acid; DCA, deoxycholic acid; CDCA, chenodeoxycholic acid; LCA, lithocholic acid), scale bar = 5 μm. Red squares indicate zoomed in area shown below. (B) Adhesion assay after co-cultivation of Caco-2 cells with bile acid stressed C. difficile. Colony forming units of three independent experiments with three technical replicates each were determined and the number of adherent bacteria per Caco-2 cell was visualized. Standard deviation is indicated and values significantly different by a Student’s t-test compared to untreated cells are marked (***p-value <0.001).

