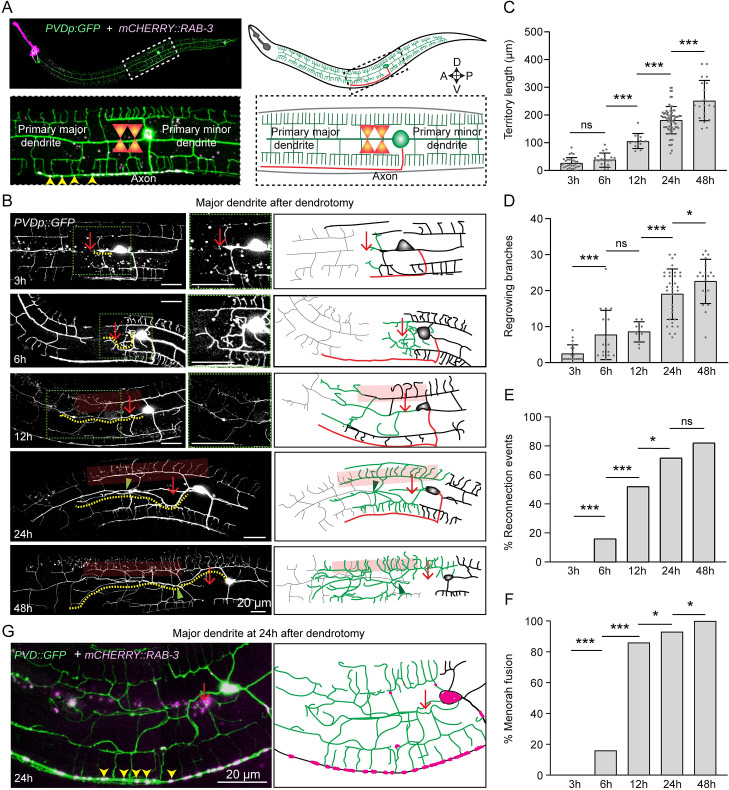
Fig 1. Primary dendrites of PVD neurons show multiple regenerative responses following dendrotomy.
(A) Representative confocal image and illustration of dendrotomy paradigm in PVD neuron labeled with soluble GFP wdIs52 (pF49H12.4::GFP) and axon marked with mCherry::RAB-3 (kyIs445,pdes-2::mcherry::RAB-3) with the region of interest (white dashed rectangle) magnified below. The primary dendrites and the axon are highlighted. The yellow arrowheads mark the axonal RAB-3 punctae. The dendrites and axons are illustrated in green and red color respectively. The two-shot dendrotomy cuts using a femtosecond laser is also illustrated. (B) The confocal images and schematics (right) showing the PVD neurons in the wild-type background at 3h, 6h,12h, 24h and 48h post-dendrotomy using two laser shots. At 3h after injury, the gap caused due to the two laser shots is shown with a red arrow. A magnified view of the regrowing end within the green dotted box is shown on the right. The faded red boxes highlight menorah-menorah fusion events, and the green arrowhead represents reconnection events between the proximal and distal primary dendrites. The regenerated part and the distal remnants are shown in green and grey colors in the illustration of the regeneration events, respectively, whereas the axon is shown in red. The longest regrowing dendrite is indicated with a yellow dotted line. (C) Quantification of the longest regrowing dendrite, which is termed as ‘territory length’. N = 3–10 independent replicates, n (number of regrowth events) = 20–70. (D) Number of regrowing branches in each timepoint. N = 3–7 independent replicates, n (number of regrowth events) = 14–34. (E-F) The percentage occurrence of reconnection events and the menorah-menorah fusion events. For E-F, N = 3–10 independent replicates, n (number of regrowth events) = 20–60. (G) Confocal images of dendrotomized PVD neuron at 24h post-dendrotomy, expressing GFP (F49H12.4::GFP) wdIs52 and (pdes-2::mCherry::rab-3) kyIs445. The localization of RAB-3 punctae is indicated using yellow arrowheads in the confocal image and red dots in the schematics. Statistics, For C-D, one-way ANOVA with Tukey’s multiple comparison test, p<0.05*, 0.01**, 0.001***. For E-F, Fisher’s exact test, p<0.05*, 0.01**, 0.001***. Error bars represent SD. ns, not significant.

