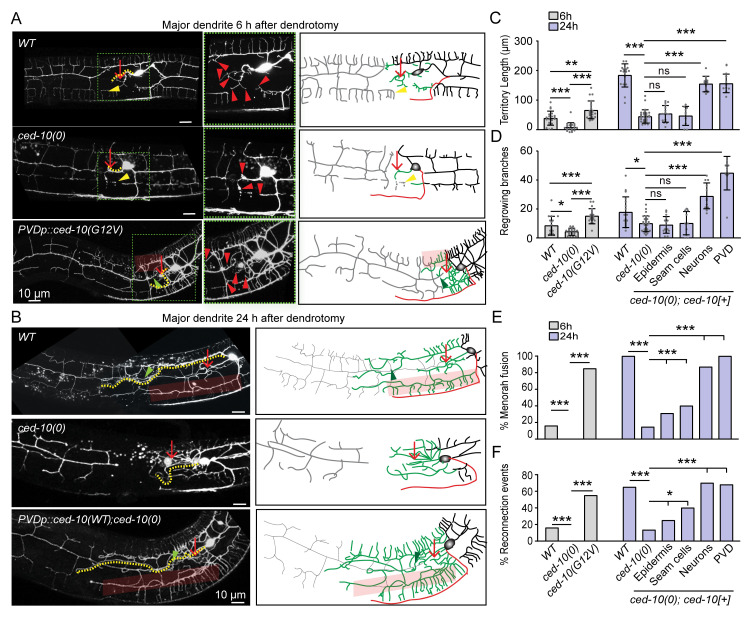
Fig 5. CED-10 is required in neuron for dendrite regeneration.
(A) Confocal images of PVD in the wildtype, ced-10(0) and pser2prom3::CED-10(G12V) (Activated CED-10) at 6h post-dendrotomy along with their schematics indicating site of dendrotomy (red arrow), regrowing dendrites (green), distal part (grey), territory length (yellow dotted lines), reconnection phenomena (green arrowheads) and menorah-menorah fusion (faded red boxes). Red arrowheads represent the filopodia like structure at the tip of the cut dendrite, yellow arrowheads represent degenerating menorah. (B) Confocal images of PVD in the wildtype, ced-10(0) and pser2prom3::ced-10(WT); ced-10(0) at 24h post-dendrotomy along with their schematics. (C-F) The quantification of territory length (C), number of regrowing branches (D), the percentage of reconnection events (E), and percentage of menorah-menorah fusion events (F) in the wild type, ced-10(0) and pser2prom3::ced-10(G12V) at 6h post-dendrotomy. For the 24h post-dendrotomy time point, the data from the wild type, ced-10(0), pdpy-7::ced-10(WT)(epidermis);ced-10(0), pgrd-10::ced-10(WT)(seam cells);ced-10(0), prgef-1::ced-10(WT)(All neurons);ced-10(0) and pser2prom3::ced-10(WT)(PVD);ced-10(0) genetic backgrounds were presented. For (C-F), N = 3–5 independent replicates, n (number of regrowth events) = 10–26. Statistics, For C-D, One-way ANOVA Tukey’s multiple comparison test considering p<0.05*, 0.01**, 0.001***. For E-F, Fisher’s exact test taking p<0.05*, 0.01**, 0.001***. Error bars represent SD. ns, not significant.

