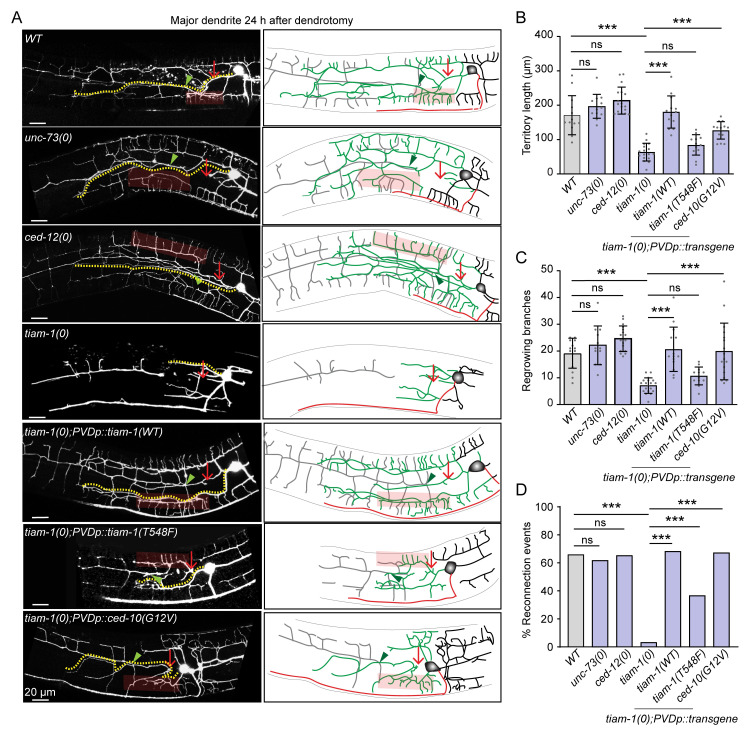
Fig 6. TIAM-1 acts upstream to CED-10 for dendrite regeneration.
(A) Confocal images of dendrotomized PVD neuron in the wild type, unc-73(0), ced-12(0), tiam-1(0), pser2prom3::tiam-1WT (5ng); tiam-1(0), pser2prom3::tiam-1(T548F)5ng;tiam-1(0) and pser2prom3::ced-10(G12V) 5ng;tiam-1(0) at 24h post-injury. The regrowing dendrites, axon, and the distal part of dendrite are represented in green, red, and grey color, respectively. The green arrowheads represent reconnection events and the faded red rectangular boxes indicate menorah-menorah fusion event. (B-C) The quantification of territory length (B), and the the number of regrowing branches (C) in the above mentioned genotypes. N = 3–5 independent replicates, n (number of regrowth events) = 10–29. (D) The bar chart represents the percentage of reconnection events for the above mentioned genotypes, N = 3–5 independent replicates, n (number of regrowth events) = 10–29. Statistics, For B-C, one-way ANOVA with Tukey’s multiple comparison test, p<0.05*, 0.01**, 0.001***. For D, Fisher’s exact test, p<0.05*, 0.01**, 0.001***. Error bars represent SD. ns, not significant.

