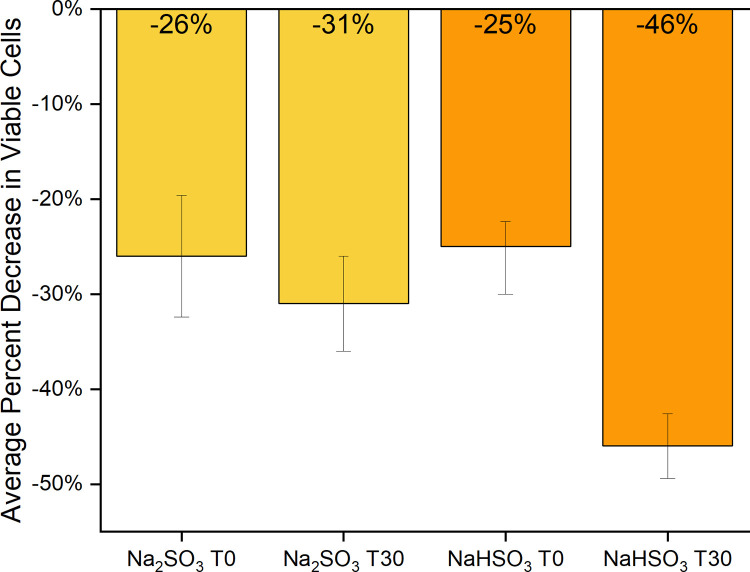
Fig 1. Average change in ATP activity after sulfite treatment.
Raw data (RLU) of all saliva samples (F1-F8 and M1-M2) treated with Na2SO3 or NaHSO3 compared to controls was used to determine the average % decrease of viable cells (based on ATP activity) in each at time 0 (T0) and time 30 (T30). The standard error of each test group was calculated, and evidence of observed difference was confirmed by both the paired t-test and the two-way ANOVA (Table 1).

