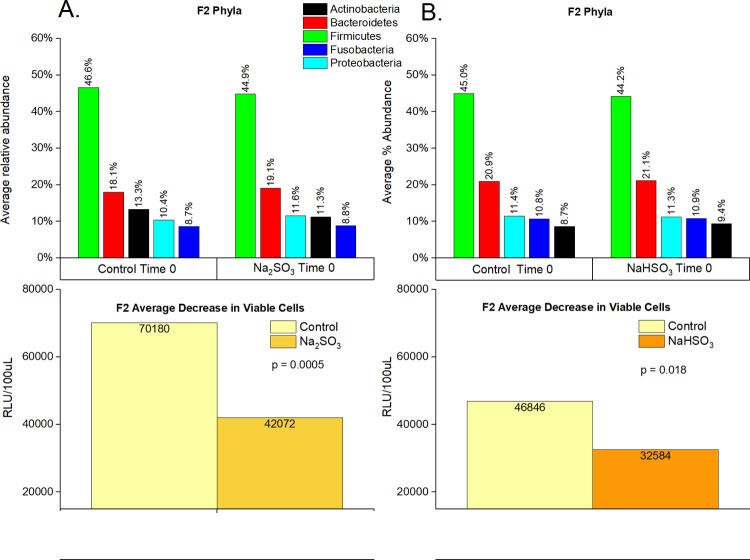
Fig 4. Cell viability and relative abundance of phyla in F2 samples before and after sulfite treatment.
F2 saliva samples (n = 32) were sequenced (16S rRNA) and the average percent abundance of the most predominant 5 phyla is displayed for untreated controls and sodium sulfite (A) or sodium bisulfite (B) treated samples at time 0. “p-values” were calculated using paired t-tests.

