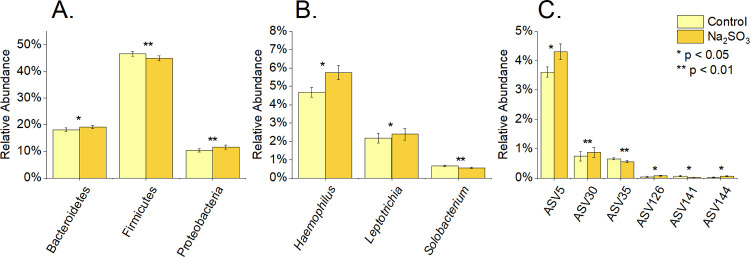
Fig 6. Differentially abundant bacteria at different taxonomic levels in F2 sample, after sodium sulfite treatment at time 0.
16S rRNA sequencing was used to determine the % relative abundance of phyla (A), genus (B), and ASV (C) for control and treated samples with Na2SO3. P values were calculated using paired t-tests.

