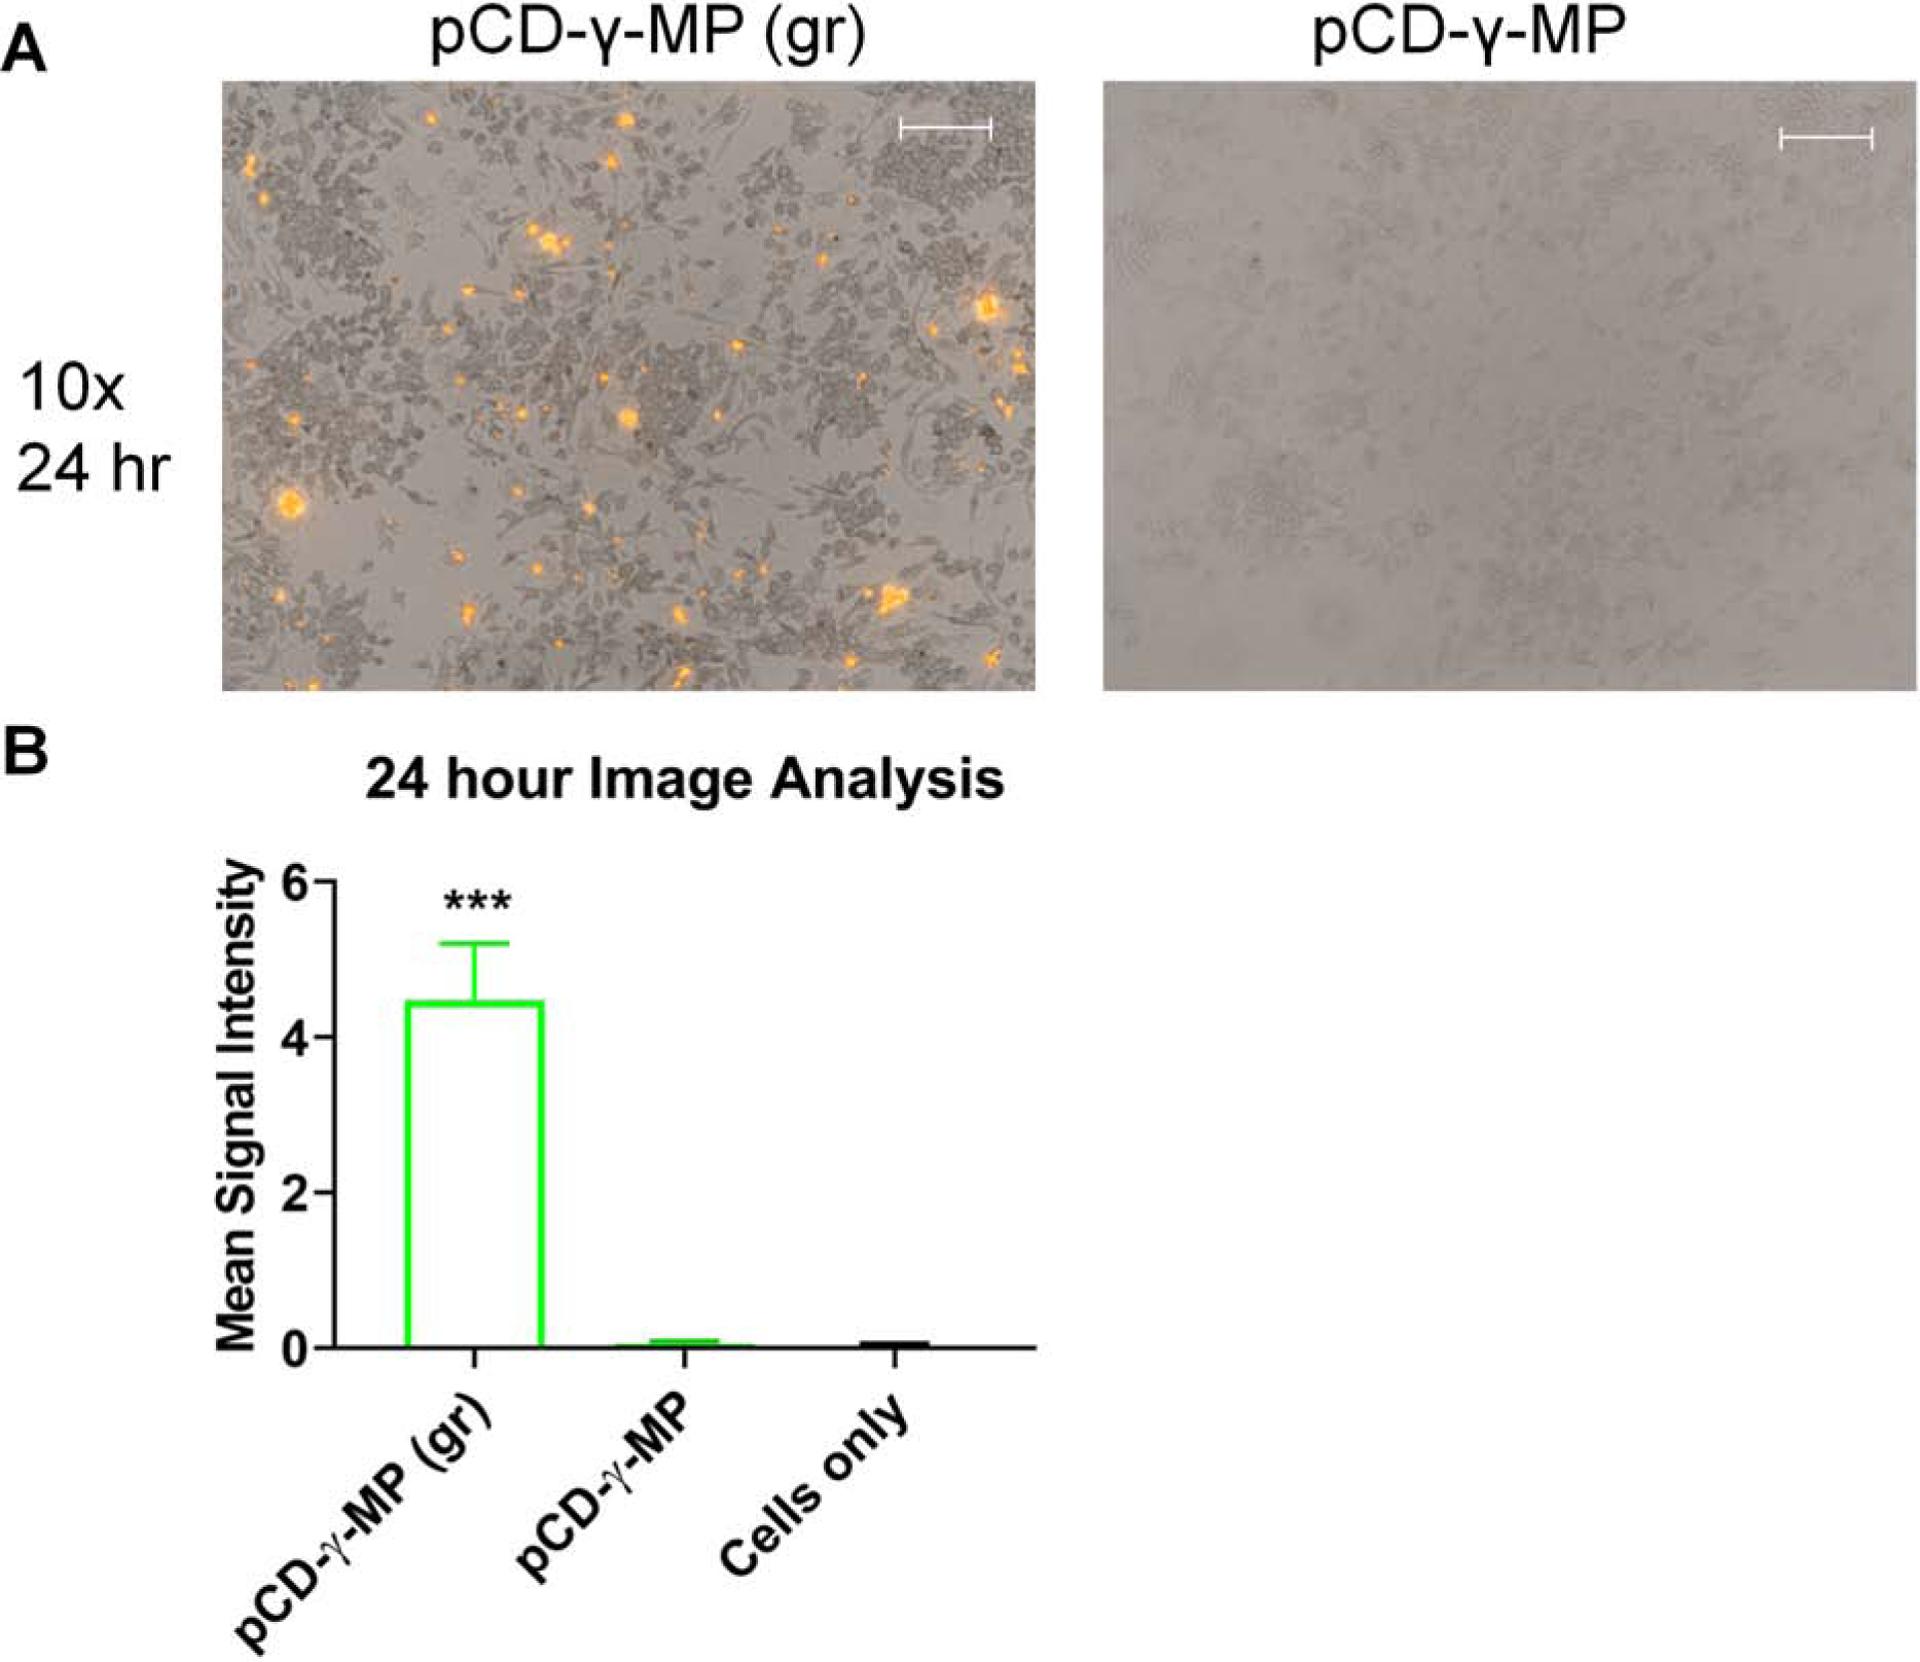
Figure 7.

The effect of particle size on macrophage uptake in vitro demonstrated by representative images (A) and averaged fluorescence signal data (B). Scale bars = 100 microns. *** indicates p < 0.001 by one-way ANOVA with Tukey test post-hoc. Average intensity from n=6–15 images per group. Error bars represent standard error of the mean.
