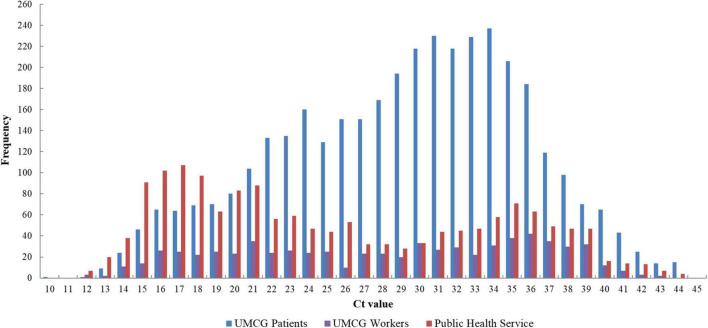
FIGURE 1.
Distribution of Ct values of SARS-CoV-2 positive patients from January 2020 to May 2021 (n = 6,035). RT-qPCR was performed by targeting the E gene of SARS-CoV-2. UMCG patient Ct values also contain follow-up samples (in-patients and out-patients). The Ct values plotted included both symptomatic and non-symptomatic detections. UMCG, University Medical Center Groningen; Ct, cycle threshold.

