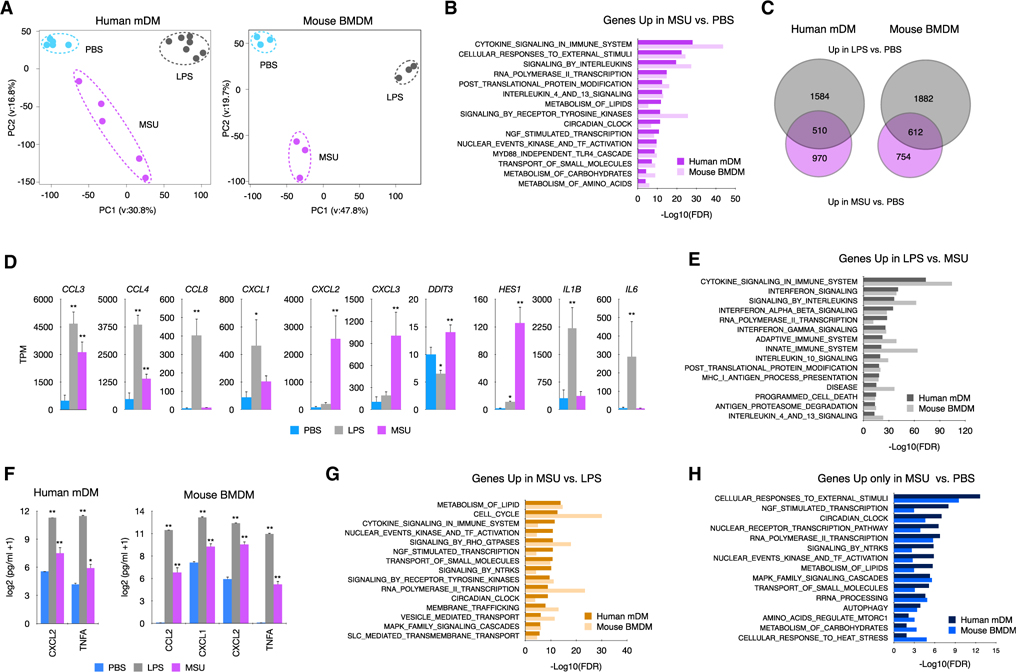
Figure 1. MSUc activates a distinct transcriptional program.
(A) Principal-component analysis of human mDMs (left) or mouse BMDMs (right) treated with LPS (100 ng/mL) or MSUc (250 μg/mL) for 5 h showing the divergence of the transcriptomic program (n ≥ 5 donors in mDMs and n = 3 for BMDMs).
(B) Gene ontology analysis of genes upregulated in macrophages treated with MSUc versus PBS showing inflammatory gene sets as well as activation of nuclear receptor, NGF, circadian clock and metabolic signaling pathways.
(C) Venn diagram showing the overlap between genes upregulated in macrophages treated with LPS or MSUc.
(D) Examples of inflammatory genes upregulated in mDMs treated with LPS or MSUc showing upregulation of some genes in MSUc but greater upregulation in LPS.
(E) Gene ontology analysis of genes downregulated in MSUc versus LPS showing inflammatory gene sets including signaling by interferons.
(F) ELISA for CXCL2 and TNFA in mDMs and additionally CCL2 and CXCL1 for BMDMs in the supernatant of macrophages treated with LPS or MSUc showing increased concentration.
(G) Gene ontology analysis using REACTOME of genes upregulated in MSUc versus LPS showing metabolic gene sets as well as activation of NGF, receptors tyrosine kinase (RTKs), and circadian clock signaling pathways.
(H) Gene ontology analysis using REACTOME of genes uniquely upregulated by MSUc showing enrichment in genes sets of response to external stimuli activation of circadian clock, NGF, and metabolic signaling pathways (#p < 0.10, *p < 0.05, **p < 0.01).

