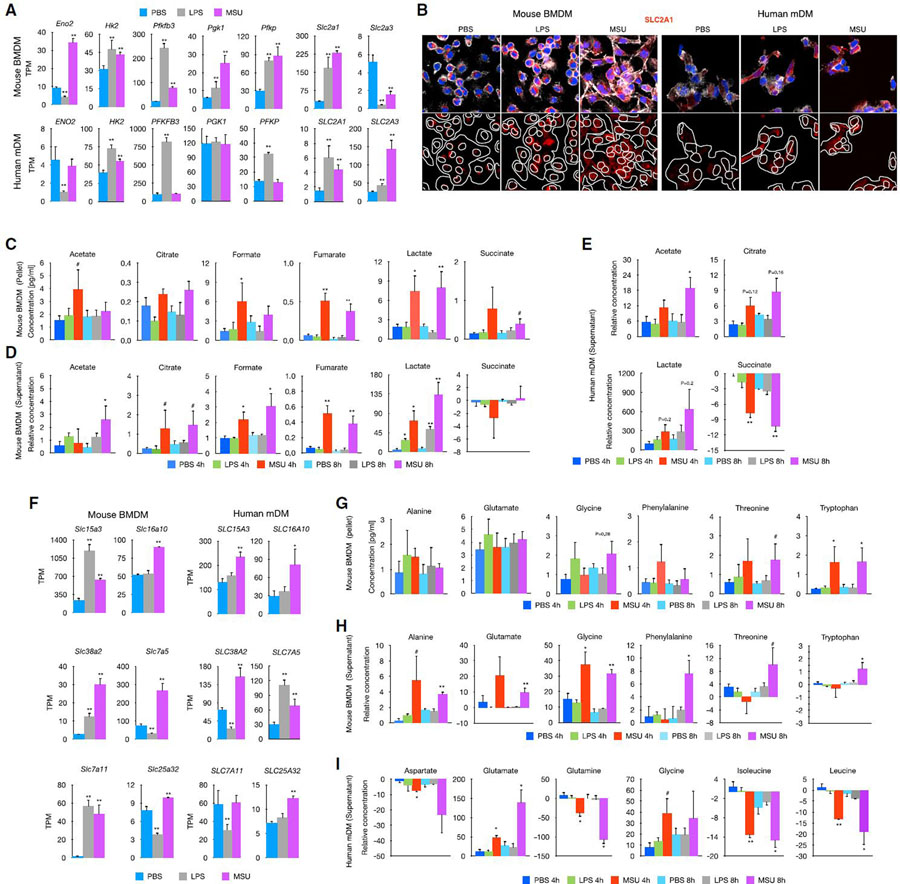
Figure 2. MSUc alters the metabolic program of macrophages.
(A) Bar plot showing upregulation of genes involved in glucose metabolism in macrophages treated with MSUc (250 μg/mL) or LPS (100 ng/mL) at 5 h.
(B) Protein analysis by IF showing upregulation of SLC2A1 in macrophages treated with MSUc or LPS at 5 h. Signal for specific antibodies is pseudocolored in red. DAPI in blue is used to delineate DNA structures.
(C and D) Analysis of the concentration of glycolytic metabolites by 1D 1H-NMR in the pellet (C) or supernatant (D) or BMDMs treated with LPS or MSUc for 4 or 8 h showing activation of glycolysis in macrophages treated with MSUc to a higher degree than LPS (n ≥ 4/condition).
(E) 1D 1H-NMR showing increased levels of acetate, citrate, and lactate and reduced levels of succinate in the supernatant of mDMs treated with MSUc for 4 or 8 h (n = 3 donors/condition).
(F) Bar graphs showing upregulation of several amino acid transporters (top) or genes involved in glycine/serine/threonine metabolism (bottom) in macrophages treated with MSUc or LPS for 5 h assessed by RNA-seq.
(G and H) 1D 1H-NMR showing increased levels of glycine, threonine, and tryptophan in the pellet (G) and alanine, glutamate, phenylalanine, and tryptophan in supernatant (H) of BMDMs treated with MSUc or LPS for 4 or 8 h (n ≥ 4/condition).
(I) 1D 1H-NMR showing increased levels of glutamate and glycine, and reduced levels of aspartate, glutamine, isoleucine, and leucine in the supernatant of mDMs treated with MSUc for 4 or 8 h (n = 3 donors/condition) (#p < 0.10, *p < 0.05, **p < 0.01).

