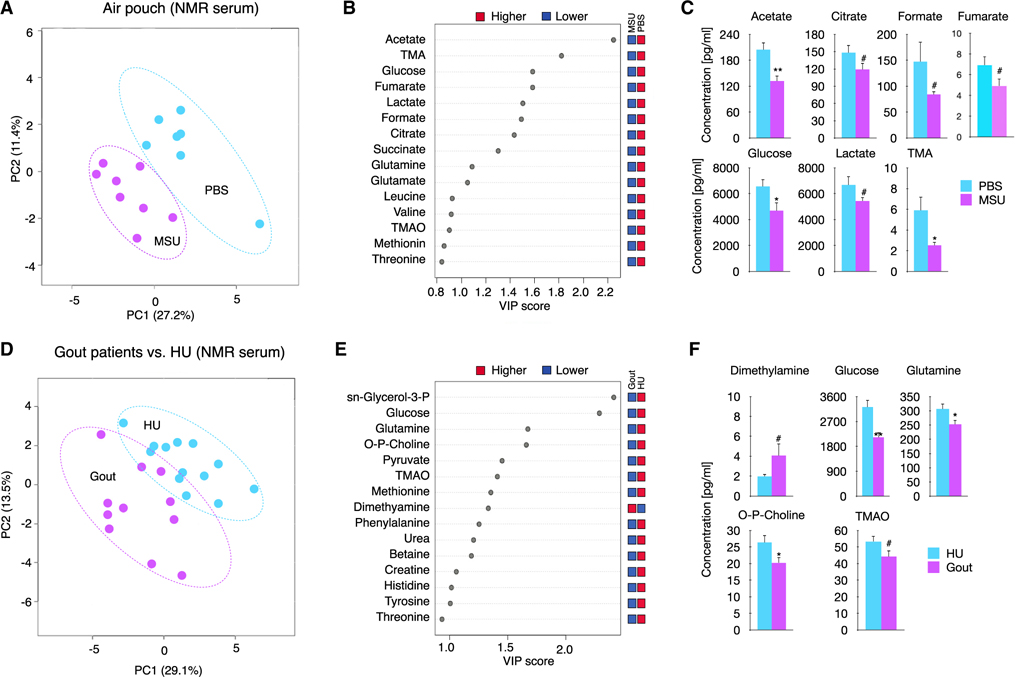
Figure 3. MSUc leads to systemic metabolic changes.
(A) PLS-DA showing serum levels of metabolites of mice injected with PBS or MSUc (3 mg) in the air pouch as assessed by 1D 1H-NMR showing the divergence between groups (n ≥ 7 mice/group).
(B) The top 15 metabolites were ranked based on variable important projection (VIP) scores from the PLS-DA model (A). The blue and red squares indicate whether metabolite abundance was higher or lower between phenotypes.
(C) Bar graphs showing reduced concentration of several metabolites including acetate, citrate, formate, fumarate, glucose, lactate, and trimethylamine (TMA) in the serum of mice collected 8 h after injected with MSUc in the air pouch.
(D) PLS-DA showing serum levels of metabolites of individuals with gout flare versus HU as assessed by 1D 1H-NMR. Data show the divergence between groups (n = 11 individuals with gout and n = 13 individuals with HU).
(E) The top 15 metabolites were ranked based on VIP scores from the PLS-DA model (B). The blue and red squares indicate whether metabolite abundance was higher or lower between phenotypes.
(F) Bar graphs show reduced concentration of several metabolites including glucose, glutamine, phosphocholine, and TMA and increased dimethylamine in the serum of individuals with gout (#p < 0.10, *p < 0.05, **p < 0.01).

