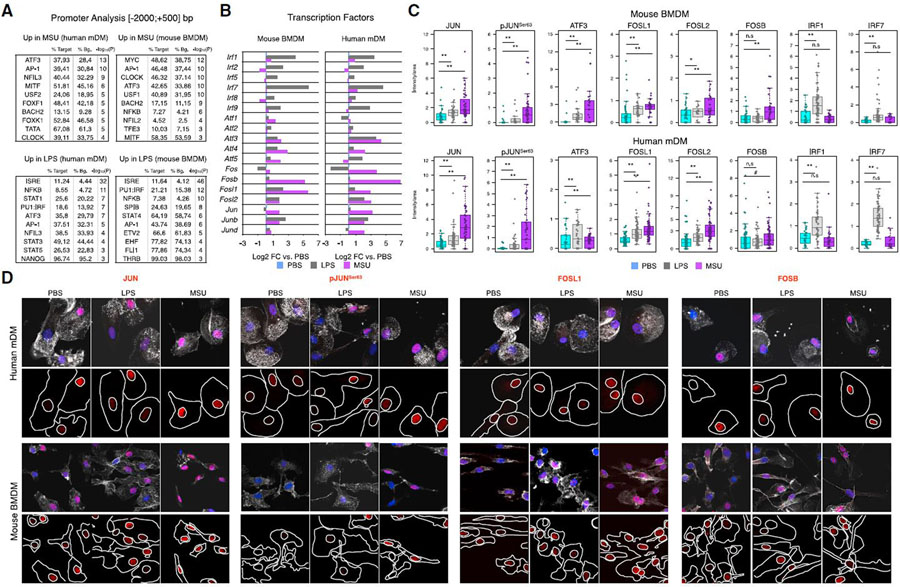
Figure 4. MSUc leads to activation of AP-1 but not IRFs.
(A) Motif analysis using HOMER of the promoter (−2,000; +500 bp, from the transcription start site) of genes upregulated by LPS (100 ng/mL) or MSUc (250 μg/mL) for 5 h in mDMs or BMDMs showing enrichment in motifs for AP-1, MYC, MITF, NRF2, and nuclear receptors—but not IRFs—in the promoters of genes upregulated by MSUc.
(B) Bar plots showing upregulation of several AP-1 members—but not IRFs—in macrophages treated with MSUc for 5 h assessed by RNA-seq. Note the higher upregulation of AP-1 in MSUc compared with LPS except for ATF3 in mDMs.
(C) Quantification of nuclear expression of JUN, pJUNSer63, ATF3, FOSL1, FOSL2, FOSB, IRF1, and IRF7 in macrophages treated with MSUc or LPS for 5 h showing upregulation of AP-1 family members—but not IRF1 or IRF7—in macrophages treated with MSUc.
(D) Representative images of protein analysis by IF showing upregulation of JUN, pJUNSer63, FOSL1, and FOSB in macrophages treated with MSUc or LPS for 5 h used to generate plots in (C). Signal for specific antibodies is pseudocolored in red. DAPI in blue is used to delineate DNA structures. Note the higher upregulation of AP-1 in MSUc compared with LPS (#p < 0.10, *p < 0.05, **p < 0.01).

