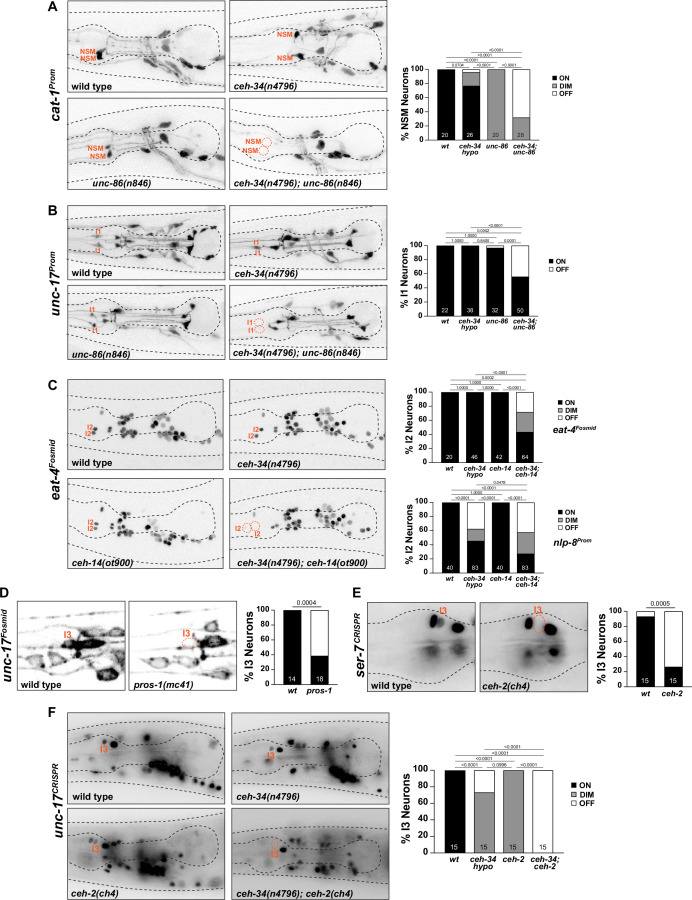
Figure 10. ceh-34 cooperates with homeobox genes to specify distinct pharyngeal neuron types.
(A) unc-86 and ceh-34 synergistically affect NSM differentiation. Representative images and quantification are shown. Reporter gene used is cat-1 (otIs224). Animals were scored at the L4 stage. Statistical analysis was performed using Fisher’s exact test. p-values were adjusted with the Holm-Sidak correction for multiple comparisons. N is indicated within each bar and represents number of neurons scored. (B) unc-86 and ceh-34 show synergistic defects in I1 neuron differentiation. Representative images and quantification are shown. Reporter gene used is unc-17 (otIs661). Animals were scored at the L4 stage. Statistical analysis was performed using Fisher’s exact test. p-values were adjusted with the Holm-Sidak correction for multiple comparisons. N is indicated within each bar and represents number of neurons scored. (C) ceh-14 and ceh-34 show synergistic effects on I2 neuron differentiation. Representative images and quantification are shown for eat-4 (otIs518). Bottom graph shows quantification for nlp-8 (otIs711). Animals were scored at the L4 stage. Statistical analysis was performed using Fisher’s exact test or chi-square test. p-values were adjusted with the Holm-Sidak correction for multiple comparisons. N is indicated within each bar and represents number of neurons scored. (D) pros-1 affects I3 neuron differentiation. Representative images and quantification are shown. Reporter gene is unc-17 (otIs576). Animals were scored at the L1 stage. Statistical analysis was performed using Fisher’s exact test. N is indicated within each bar and represents number of neurons scored. (E) ceh-2 affects I3 neuron differentiation. Representative images and quantification are shown. Reporter gene used is a CRISPR/Cas9-enginereed allele for ser-7 (syb4502). Animals were scored at the L4 stage. Statistical analysis was performed using Fisher’s exact test. N is indicated within each bar and represents number of neurons scored. (F) ceh-2 and ceh-34 show synergistic defects in I3 neuron differentiation. Representative images and quantification are shown. Reporter gene used is CRISPR/Cas9-engineered allele for unc-17 (syb4491). Animals were scored at the L4 stage. Statistical analysis was performed using Fisher’s exact test. p-values were adjusted with the Holm-Sidak correction for multiple comparisons. N is indicated within each bar and represents number of neurons scored.

