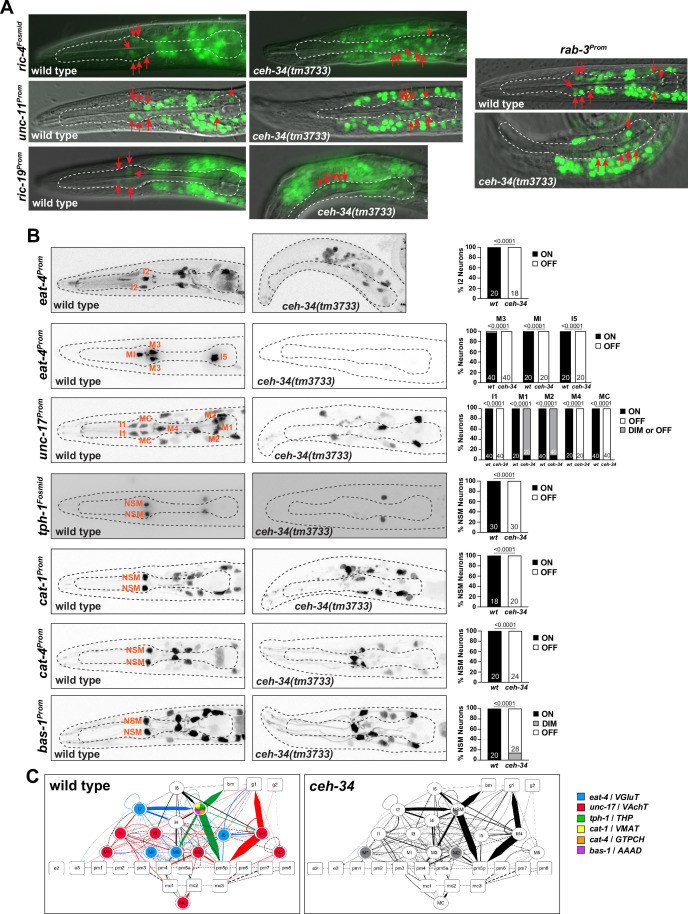
Figure 3. Pharyngeal neurons are generated in ceh-34 mutants but lose their neurotransmitter identity.
(A) Pictures at the L1 stage showing expression of pan-neuronal reporter transgenes that monitor ric-4 (otIs350), ric-19 (otIs380), unc-11 (otIs620), and rab-3 (otIs291) expression. A single focal plane with a subset of pharyngeal neurons marked with red arrows is shown for clarity. (B) ceh-34 affects the expression of neurotransmitter identity genes. Glutamatergic, cholinergic, and serotonergic identity is lost. Reporter transgenes used are eat-4 (otIs487, otIs558), unc-17 (otIs661), tph-1 (otIs517), cat-1 (otIs221), cat-4 (otIs225), and bas-1 (otIs226). Animals were scored at the L1 stage. Statistical analysis was performed using Fisher’s exact test or chi-square test. N is indicated within each bar and represents number of neurons scored. (C) Circuit diagram summarizing the effect of ceh-34 on neurotransmitter identity. Nodes are colored to illustrate neurotransmitter identity gene expression. Nodes lose coloring when expression is affected in ceh-34 mutants (gray indicates partial effect). Edges are colored if the source neuron expresses either eat-4 (glutamatergic), unc-17 (cholinergic), or tph-1 (serotonergic). Edges lose coloring when expression of these genes is affected in the source neuron in ceh-34 mutants (irrespective of whether the effect is partial or total). Note that in this and ensuing circuit diagrams, the existence of gray edges does not indicate whether those edges are generated properly in ceh-34 mutants. Directed edges (arrows) represent chemical synapses. Undirected edges (dashed lines) represent electrical synapses. The width of the edge is proportional to the weight of the connection (the number of serial section electron micrographs where a synaptic specialization is observed).

