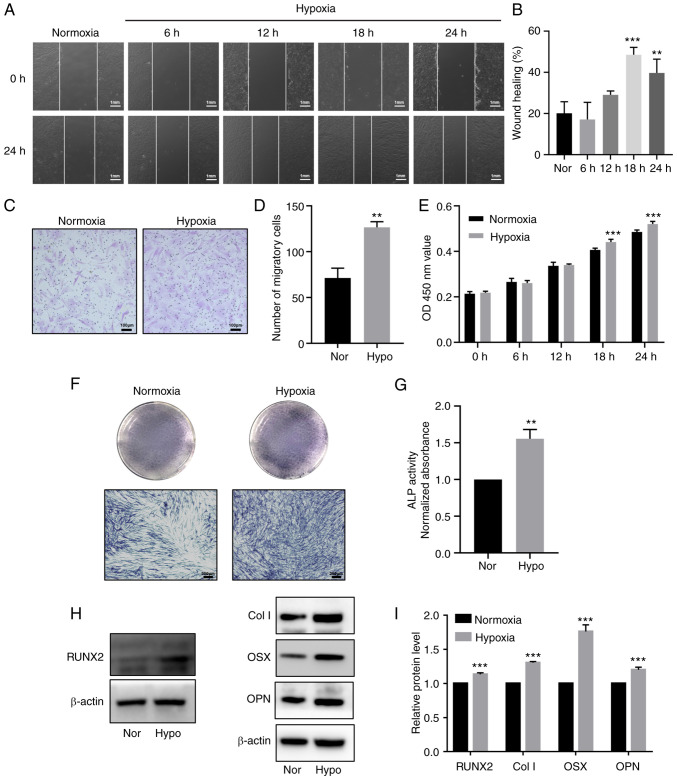
Figure 3.
Hypoxia promotes proliferation, migration and odontoblastic differentiation in HDPCs. (A) Representative images of wound healing assays in the normoxic or hypoxic group. Scale bar, 1 mm. (B) Percentages of wound closure from three independent experiments are quantified. (C) Representative images of migratory cells stained with crystal violet. (D) Statistical quantification of the number of migratory cells from three independent experiments are shown. Scale bar, 100 µm. (E) Cell viability of HDPCs was detected using Cell Counting Kit-8 analysis. (F) ALP staining and (G) activity in the normoxic or hypoxic group on day 3. Scale bar, 200 µm. (H) Representative western blotting images showing the protein expression levels of RUNX2, Col I, OSX and OPN in the normoxic or hypoxic group on day 3, (I) which were quantified. Results are presented as the means ± SD from ≥ three independent experiments. **P<0.01 and ***P<0.001 vs. normoxia. Nor, normoxia; Hypo, hypoxia; OD, optical density; ALP, alkaline phosphatase; RUNX2, runt-related transcription factor 2; Col I, collagen type I; OSX, osterix; OPN, osteopontin.

